

PAP: a comprehensive workbench for mammalian transcriptional regulatory sequence analysis
- PMID: 17517777
- PMCID: PMC1933204
- DOI: 10.1093/nar/gkm308
PAP: a comprehensive workbench for mammalian transcriptional regulatory sequence analysis
Abstract
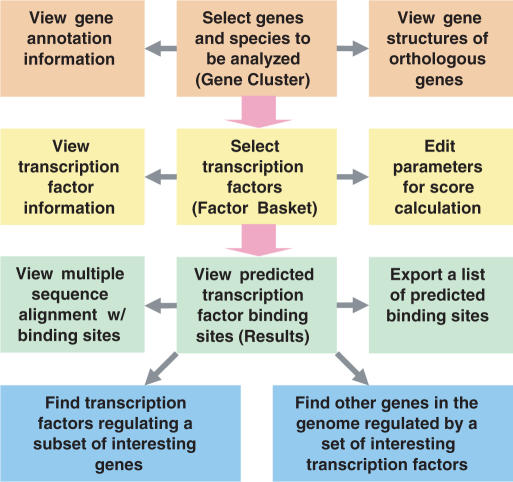
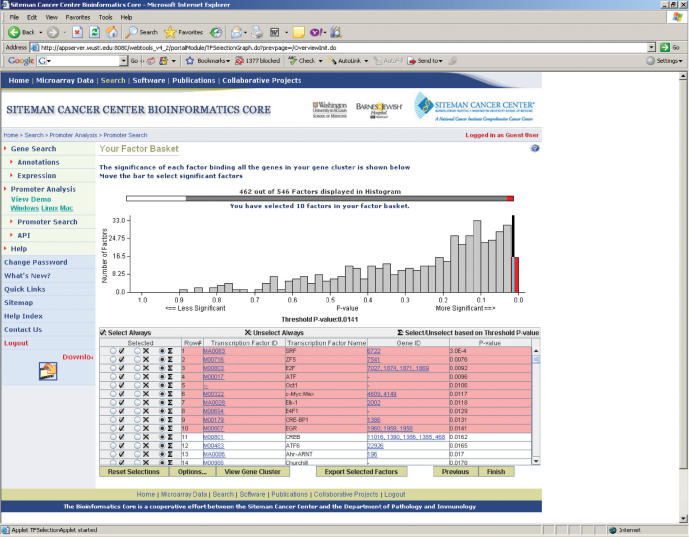
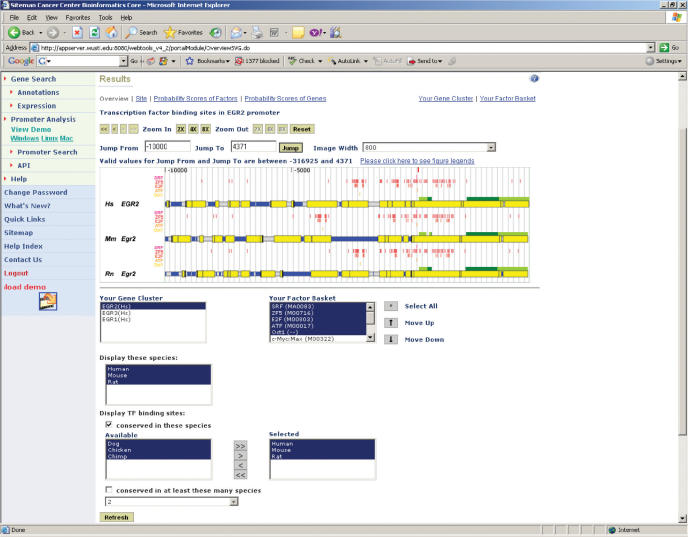
Given the recent explosion of publications that employ microarray technology to monitor genome-wide expression and that correlate these expression changes to biological processes or to disease states, the determination of the transcriptional regulation of these co-expressed genes is the next major step toward deciphering the genetic network governing the pathway or disease under study. Although computational approaches have been proposed for this purpose, there is no integrated and user-friendly software application that allows experimental biologists to tackle this problem in higher eukaryotes. We have previously reported a systematic, statistical model of mammalian transcriptional regulatory sequence analysis. We have now made crucial extensions to this model and have developed a comprehensive, user-friendly web application suite termed the Promoter Analysis Pipeline (PAP). PAP is available at: http://bioinformatics.wustl.edu/webTools/portalModule/PromoterSearch.do.
Figures
References
-
- Tenen DG. Disruption of differentiation in human cancer: AML shows the way. Nat. Rev. Cancer. 2003;3:89–101. - PubMed
-
- Mooradian AD, Haas MJ, Wong NC. Transcriptional control of apolipoprotein A-I gene expression in diabetes. Diabetes. 2004;53:513–520. - PubMed
-
- Davicioni E, Finckenstein FG, Shahbazian V, Buckley JD, Triche TJ, Anderson MJ. Identification of a PAX-FKHR gene expression signature that defines molecular classes and determines the prognosis of alveolar rhabdomyosarcomas. Cancer Res. 2006;66:6936–6946. - PubMed
-
- Segal E, Friedman N, Kaminski N, Regev A, Koller D. From signatures to models: understanding cancer using microarrays. Nat. Genet. 2005;37(Suppl. 1):S38–45. - PubMed
Publication types
MeSH terms
Substances
Grants and funding
LinkOut - more resources
Full Text Sources
Research Materials
