Comparative Study
. 2007 Jun 11;204(6):1417-29.
doi: 10.1084/jem.20061929. Epub 2007 May 21.

Increased susceptibility to colitis and colorectal tumors in mice lacking core 3-derived O-glycans

Affiliations
Comparative Study

Increased susceptibility to colitis and colorectal tumors in mice lacking core 3-derived O-glycans

Guangyu An et al. J Exp Med. .

Abstract

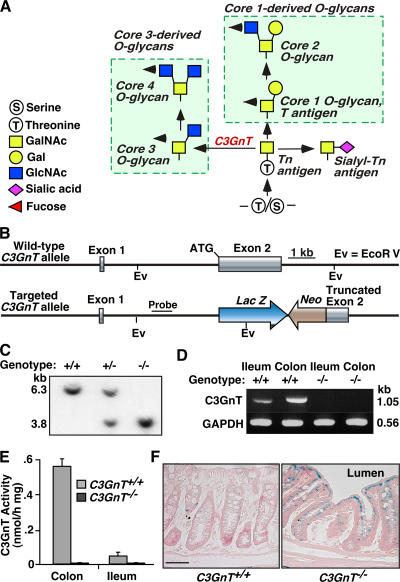
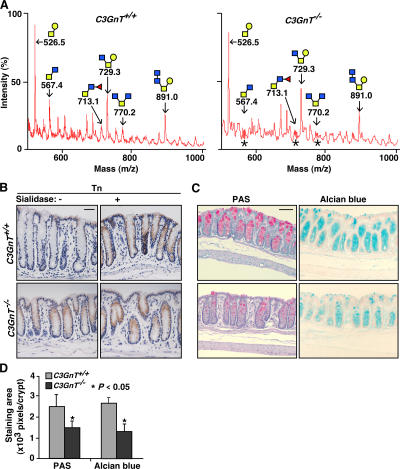
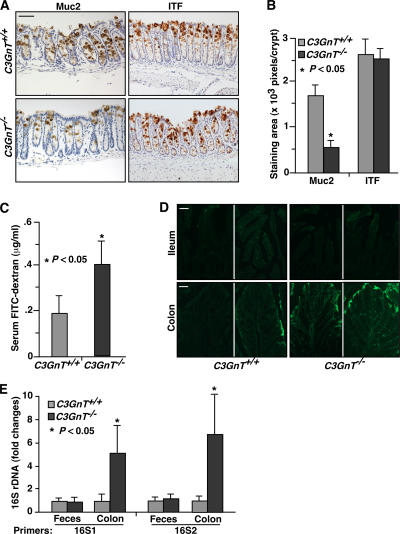
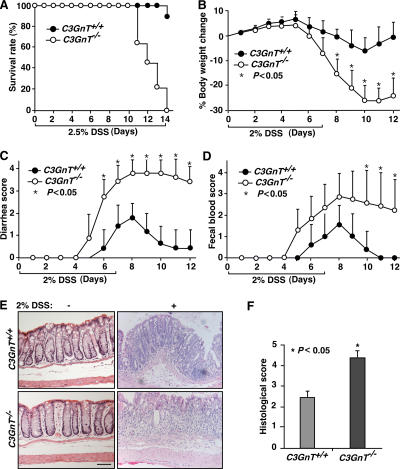
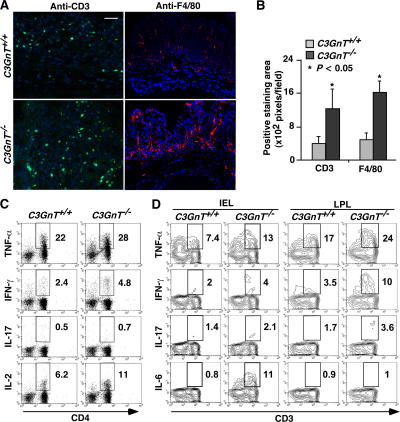
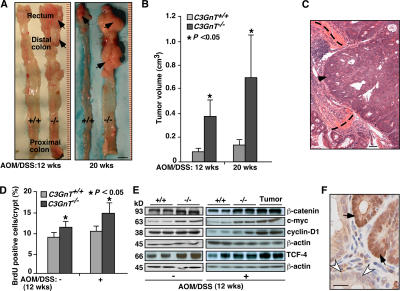
Altered intestinal O-glycan expression has been observed in patients with ulcerative colitis and colorectal cancer, but the role of this alteration in the etiology of these diseases is unknown. O-glycans in mucin core proteins are the predominant components of the intestinal mucus, which comprises part of the intestinal mucosal barrier. Core 3-derived O-glycans, which are one of the major types of O-glycans, are primarily expressed in the colon. To investigate the biological function of core 3-derived O-glycans, we engineered mice lacking core 3 beta1,3-N-acetylglucosaminyltransferase (C3GnT), an enzyme predicted to be important in the synthesis of core 3-derived O-glycans. Disruption of the C3GnT gene eliminated core 3-derived O-glycans. C3GnT-deficient mice displayed a discrete, colon-specific reduction in Muc2 protein and increased permeability of the intestinal barrier. Moreover, these mice were highly susceptible to experimental triggers of colitis and colorectal adenocarcinoma. These data reveal a requirement for core 3-derived O-glycans in resistance to colonic disease.


Figures

Figure 1.
Figure 1.
Generation of C3GnT−/− mice. (A) The scheme shows the two major O-glycan branching pathways. C3GnT refers to C3GnT. Arrowheads show the possible pathways for further branching, elongation, fucosylation, sialylation, and sulfation. (B and C) Strategy to generate mice lacking core 3–derived O-glycans by targeting the C3GnT gene, and Southern blot genotyping using EcoRV restriction enzyme digestion. (D) RT-PCR confirmed the deletion of the C3GnT gene product. GAPDH was used as an amplification control. (E) C3GnT enzymatic activity in C3GnT +/+ and C3GnT −/− tissues. Error bars represent the mean ± the SD. n = 3. (F) LacZ staining of C3GnT +/+ and C3GnT −/− colonic tissues. Bar, 100 μm.
Figure 2.
Figure 2.
Disruption of the C3GnT gene eliminates core 3–derived O-glycans and exposes the Tn antigen in murine colons. (A) Annotated spectra of matrix-assisted laser desorption/ionization time-of-flight mass spectrometry (MALDI-TOF-MS) analyses of 2-AB–labeled O-glycans of C3GnT +/+ and C3GnT −/− colons in a linear-positive mode. Each annotated molecular mass of O-glycan includes masses of a 2-AB and a Na. Asterisks represent positions of core 3–derived O-glycans that are missing in C3GnT −/− mice. Data are representatives of three experiments. (B) Immunohistochemical staining of mouse colon tissue sections with a mAb to the Tn antigen. The sections were pretreated with or without sialidase. Brown reaction products mark sites of antibody binding. Data are representatives of at least three experiments. (C) C3GnT +/+ and C3GnT −/− colonic tissues stained with PAS (pink color) and Alcian blue (blue color). (D) Pixels of PAS and Alcian blue staining areas were quantified by Photoshop software based on six sections of three independent mice from each group. Error bars represent the mean ± the SD. Bars: (B) 50 μm; (C) 100 μm.
Figure 3.
Figure 3.
C3GnT−/− colon has reduced expression of Muc2 and impaired mucosal integrity. (A) Immunohistochemical staining of C3GnT +/+ and C3GnT −/− colonic tissues with an anti-murine Muc2 peptide antibody and with an antibody to ITF, which is a marker of fully differentiated goblet cells. Brown color indicates specific antibody binding. (B) Pixels of positive staining area per crypt were quantified using Photoshop. Six sections of three independent mice from each group were quantified. Error bars represent the mean ± the SD. (C) Serum concentration of the FITC-dextran of C3GnT +/+ and C3GnT −/− mice were measured 4 h after oral administration of FITC-dextran. Error bars represent the mean ± the SD. n = 6. (D) Representative images of fluorescent microscopic analysis of C3GnT +/+ and C3GnT −/− intestinal cryosections 4 h after oral administration of FITC-Dextran (three sections from each mouse, with four mice in each group). (E) Relative amount of 16S rDNA detected by real-time PCR using two independent sets of 16S universal primers. Data are expressed as an n-fold difference between C3GnT +/+ and C3GnT −/− mice. Error bars represent the mean ± the SD. n = 6 mice in each group. The average 16S rDNA value of C3GnT +/+ mice was expressed as 1. Bars: (A) 100 μm; (D) 50 μm.
Figure 4.
Figure 4.
C3GnT−/− mice have more severe DSS-induced colitis. (A) Survival rate of a cohort of 10 age-matched C3GnT +/+ and C3GnT −/− males after a 14-d, 2.5% DSS treatment. (B–D) Percent body weight changes compared with baseline, diarrhea score, and fecal blood score in 6-wk-old C3GnT +/+ and C3GnT −/− males after a 7-d, 2% DSS treatment. Each point represents the mean ± the SEM. n = 10. (E) Hematoxylin and eosin–stained colonic tissues of C3GnT +/+ and C3GnT −/− mice with or without 2% DSS treatment. Bar, 100 μm. (F) Histopathological scores of C3GnT +/+ and C3GnT −/− mice 7 d after 2% DSS treatment based on degrees of inflammatory cell infiltration and epithelial injury. Error bars indicate mean ± the SEM. n = 12.
Figure 5.
Figure 5.
C3GnT−/− colon has increased infiltration of T lymphocytes and monocytes/macrophages, and C3GnT−/− CD4 T cells have increased intracellular expression of IL-2, IFN-γ, and TNF-α after 2% DSS treatment. (A) CD3-positive lymphocyte (green) or F4/80-positive monocyte/macrophage (red) infiltrates C3GnT +/+ and C3GnT −/− colon after 2% DSS treatment. Bar, 50 μm. (B) Positive staining areas were quantified as pixels per high-powered microscopic field (20×) using Photoshop based on six sections from three independent mice from each group. Error bars indicate the mean ± the SD. (C) Flow cytometric analysis of intracellular cytokine expression in splenic CD4+ T cells isolated from either C3GnT +/+ or C3GnT −/− mice after 2% DSS treatment. The plots were gated on CD3+ population. The number in each image indicates the percentage of CD4+ T cells. This result is representative of data of three experiments (three C3GnT +/+ and three C3GnT −/− mice in each experiment). (D) Flow cytometric analysis of intracellular cytokine expression in CD3+ IEL and LPL isolated from the colon of C3GnT +/+ or C3GnT −/− mice without DSS treatment. The number in each image indicates the percentages of cytokine-expressing CD3+ cells. This result is representative of data of age-matched males in the 129/SvlmJ background (three C3GnT +/+ and four C3GnT −/− mice).
Figure 6.
Figure 6.
Accelerated colorectal tumorigenesis in C3GnT−/− mice after AOM/DSS treatment. (A) Representative luminal views of C3GnT +/+ and C3GnT −/− colons. Arrows indicate tumors. (B) Quantification of colonic tumor volume in C3GnT +/+ and C3GnT −/− mice. Error bars represent the mean ± the SD. n = 7. (C) Representative histopathological features of colorectal adenocarcinomas in C3GnT −/− mice. Arrowhead points to invasive neoplastic glands. Dashed lines depict the muscularis mucosae. (D) Quantification of BrdU-labeled proliferating colonic epithelial cells of C3GnT +/+ and C3GnT −/− mice with or without AOM/DSS treatments. Error bars indicate the mean ± the SD. n = 5. (E) Expression of β-catenin, TCF-4, c-myc, and cyclin-D1 in C3GnT +/+ and C3GnT −/− colonic tissues measured by Western blots. β-Actin was used as a loading control. The data represent at least three experiments. (F) Immunohistochemical staining illustrates nuclear localization of β-catenin in C3GnT −/− colonic neoplastic tissues (dark brown, arrows), whereas the nuclei of control normal epithelial cells had no β-catenin staining (white arrowheads). The data are representative of at least three experiments. Bars: (A) 1 cm; (C) 100 μm; (F) 50 μm.

Comment in

Similar articles

Cited by

References

    1. Varki, A., R. Cummings, J. Esko, H. Freeze, G. Hart, and J. Marth. 1999. Essentials of Glycobiology. Cold Spring Harbor Laboratory Press, Cold Spring Harbor, New York. 653 pp. - PubMed
    1. Brockhausen, I., and W. Kuhns. 1997. Glycoproteins and Human Disease. R.G. Landes Company, Austin, Texas. 204 pp.
    1. Rhodes, J.M. 1996. Unifying hypothesis for inflammatory bowel disease and associated colon cancer: sticking the pieces together with sugar. Lancet. 347:40–44. - PubMed
    1. Rhodes, J.M. 1997. Colonic mucus and ulcerative colitis. Gut. 40:807–808. - PMC - PubMed
    1. Podolsky, D.K., and K.J. Isselbacher. 1984. Glycoprotein composition of colonic mucosa. Specific alterations in ulcerative colitis. Gastroenterology. 87:991–998. - PubMed

Publication types

MeSH terms