

Vaccinating to protect a vulnerable subpopulation
- PMID: 17518515
- PMCID: PMC1872043
- DOI: 10.1371/journal.pmed.0040174
Vaccinating to protect a vulnerable subpopulation
Abstract
Background: Epidemic influenza causes serious mortality and morbidity in temperate countries each winter. Research suggests that schoolchildren are critical in the spread of influenza virus, while the elderly and the very young are most vulnerable to the disease. Under these conditions, it is unclear how best to focus prevention efforts in order to protect the population. Here we investigate the question of how to protect a population against a disease when one group is particularly effective at spreading disease and another group is more vulnerable to the effects of the disease.
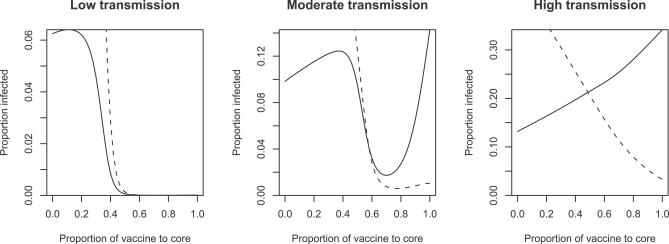
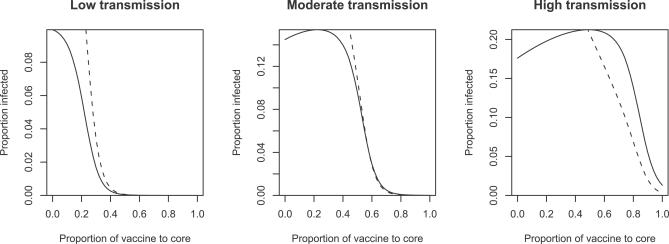
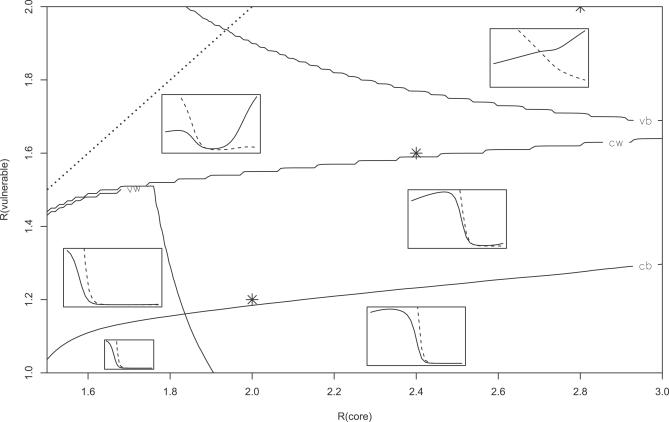
Methods and findings: We developed a simple mathematical model of an epidemic that includes assortative mixing between groups of hosts. We evaluate the impact of different vaccine allocation strategies across a wide range of parameter values. With this model we demonstrate that the optimal vaccination strategy is extremely sensitive to the assortativity of population mixing, as well as to the reproductive number of the disease in each group. Small differences in parameter values can change the best vaccination strategy from one focused on the most vulnerable individuals to one focused on the most transmissive individuals.
Conclusions: Given the limited amount of information about relevant parameters, we suggest that changes in vaccination strategy, while potentially promising, should be approached with caution. In particular, we find that, while switching vaccine to more active groups may protect vulnerable groups in many cases, switching too much vaccine, or switching vaccine under slightly different conditions, may lead to large increases in disease in the vulnerable group. This outcome is more likely when vaccine limitation is stringent, when mixing is highly structured, or when transmission levels are high.
Conflict of interest statement
Figures
References
-
- Bridges CB, Harper SA, Fukuda K, Uyeki TM, Cox NJ, et al. Prevention and control of influenza: Recommendations of the advisory committee on immunization practices (ACIP) MMWR. 2003;52(RR08):1–36. - PubMed
-
- Centers for Disease Control. Updated interim influenza vaccination recommendations 2004–05 influenza season. MMWR. 2004;53:1183–1184. - PubMed
-
- Gruber WC. Children as a target for immunization. In: Nicholson KG, Webster RG, editors. Textbook of influenza. Oxford: Blackwell Science; 1998. pp. 435–444.
-
- Reichert TA, Sugaya N, Fedson DS, Glezen WP, Simonsen L, et al. The Japanese experience with vaccinating schoolchildren against influenza. N Engl J Med. 2001;344:889–896. - PubMed
MeSH terms
Substances
LinkOut - more resources
Full Text Sources
Medical
