

RNA quality in frozen breast cancer samples and the influence on gene expression analysis--a comparison of three evaluation methods using microcapillary electrophoresis traces
- PMID: 17519006
- PMCID: PMC1891312
- DOI: 10.1186/1471-2199-8-38
RNA quality in frozen breast cancer samples and the influence on gene expression analysis--a comparison of three evaluation methods using microcapillary electrophoresis traces
Abstract
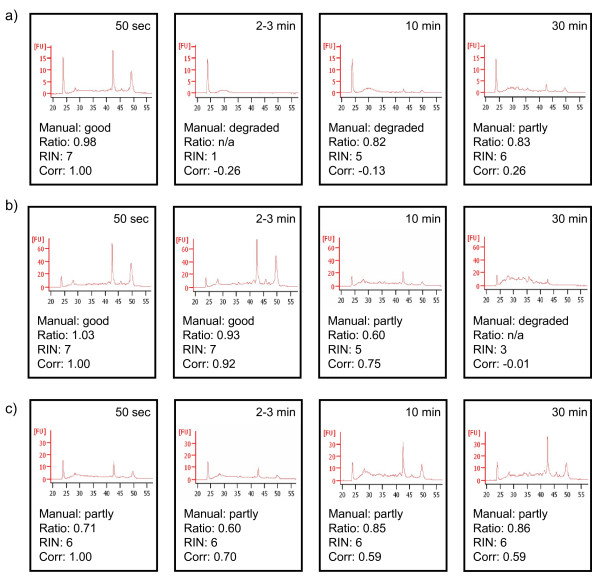
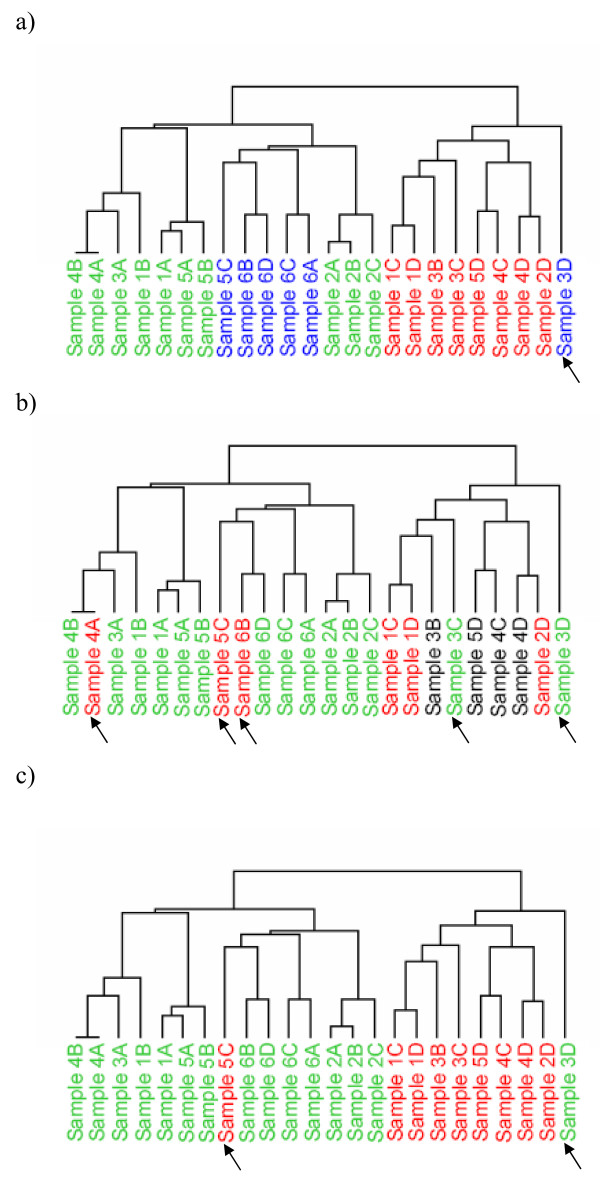
Background: Assessing RNA quality is essential for gene expression analysis, as the inclusion of degraded samples may influence the interpretation of expression levels in relation to biological and/or clinical parameters. RNA quality can be analyzed by agarose gel electrophoresis, UV spectrophotometer, or microcapillary electrophoresis traces, and can furthermore be evaluated using different methods. No generally accepted recommendations exist for which technique or evaluation method is the best choice. The aim of the present study was to use microcapillary electrophoresis traces from the Bioanalyzer to compare three methods for evaluating RNA quality in 24 fresh frozen invasive breast cancer tissues: 1) Manual method = subjective evaluation of the electropherogram, 2) Ratio Method = the ratio between the 28S and 18S peaks, and 3) RNA integrity number (RIN) method = objective evaluation of the electropherogram. The results were also related to gene expression profiling analyses using 27K oligonucleotide microarrays, unsupervised hierarchical clustering analysis and ontological mapping.
Results: Comparing the methods pair-wise, Manual vs. Ratio showed concordance (good vs. degraded RNA) in 20/24, Manual vs. RIN in 23/24, and Ratio vs. RIN in 21/24 samples. All three methods were concordant in 20/24 samples. The comparison between RNA quality and gene expression analysis showed that pieces from the same tumor and with good RNA quality clustered together in most cases, whereas those with poor quality often clustered apart. The number of samples clustering in an unexpected manner was lower for the Manual (n = 1) and RIN methods (n = 2) as compared to the Ratio method (n = 5). Assigning the data into two groups, RIN > or = 6 or RIN < 6, all but one of the top ten differentially expressed genes showed decreased expression in the latter group; i.e. when the RNA became degraded. Ontological mapping using GoMiner (p < or = 0.05; > or = 3 genes changed) revealed deoxyribonuclease activity, collagen, regulation of cell adhesion, cytosolic ribosome, and NADH dehydrogenase activity, to be the five categories most affected by RNA quality.
Conclusion: The results indicate that the Manual and RIN methods are superior to the Ratio method for evaluating RNA quality in fresh frozen breast cancer tissues. The objective measurement when using the RIN method is an advantage. Furthermore, the inclusion of samples with degraded RNA may profoundly affect gene expression levels.
Figures


References
-
- Sorlie T, Perou CM, Tibshirani R, Aas T, Geisler S, Johnsen H, Hastie T, Eisen MB, van de Rijn M, Jeffrey SS, Thorsen T, Quist H, Matese JC, Brown PO, Botstein D, Eystein Lonning P, Borresen-Dale AL. Gene expression patterns of breast carcinomas distinguish tumor subclasses with clinical implications. Proc Natl Acad Sci USA. 2001;98:10869–10874. doi: 10.1073/pnas.191367098. - DOI - PMC - PubMed
-
- van't Veer LJ, Dai H, van de Vijver MJ, He YD, Hart AA, Mao M, Peterse HL, van der Kooy K, Marton MJ, Witteveen AT, Schreiber GJ, Kerkhoven RM, Roberts C, Linsley PS, Bernards R, Friend SH. Gene expression profiling predicts clinical outcome of breast cancer. Nature. 2002;415:530–536. doi: 10.1038/415530a. - DOI - PubMed
-
- van de Vijver MJ, He YD, van't Veer LJ, Dai H, Hart AA, Voskuil DW, Schreiber GJ, Peterse JL, Roberts C, Marton MJ, Parrish M, Atsma D, Witteveen A, Glas A, Delahaye L, van der Velde T, Bartelink H, Rodenhuis S, Rutgers ET, Friend SH, Bernards R. A gene-expression signature as a predictor of survival in breast cancer. N Engl J Med. 2002;347:1999–2009. doi: 10.1056/NEJMoa021967. - DOI - PubMed
-
- Hedenfalk I, Duggan D, Chen Y, Radmacher M, Bittner M, Simon R, Meltzer P, Gusterson B, Esteller M, Kallioniemi OP, Wilfond B, Borg A, Trent J, Raffeld M, Yakhini Z, Ben-Dor A, Dougherty E, Kononen J, Bubendorf L, Fehrle W, Pittaluga S, Gruvberger S, Loman N, Johannsson O, Olsson H, Sauter G. Gene-expression profiles in hereditary breast cancer. N Engl J Med. 2001;344:539–548. doi: 10.1056/NEJM200102223440801. - DOI - PubMed
-
- Gruvberger S, Ringner M, Chen Y, Panavally S, Saal LH, Borg A, Ferno M, Peterson C, Meltzer PS. Estrogen receptor status in breast cancer is associated with remarkably distinct gene expression patterns. Cancer Res. 2001;61:5979–5984. - PubMed
Publication types
MeSH terms
Substances
LinkOut - more resources
Full Text Sources
Other Literature Sources
Medical
Molecular Biology Databases
Miscellaneous
