. 2007 May 22:8:125.
doi: 10.1186/1471-2164-8-125.

Transcriptional profiling of Arabidopsis heat shock proteins and transcription factors reveals extensive overlap between heat and non-heat stress response pathways

Affiliations

Transcriptional profiling of Arabidopsis heat shock proteins and transcription factors reveals extensive overlap between heat and non-heat stress response pathways

William R Swindell et al. BMC Genomics. .

Abstract

Background: The heat shock response of Arabidopsis thaliana is dependent upon a complex regulatory network involving twenty-one known transcription factors and four heat shock protein families. It is known that heat shock proteins (Hsps) and transcription factors (Hsfs) are involved in cellular response to various forms of stress besides heat. However, the role of Hsps and Hsfs under cold and non-thermal stress conditions is not well understood, and it is unclear which types of stress interact least and most strongly with Hsp and Hsf response pathways. To address this issue, we have analyzed transcriptional response profiles of Arabidopsis Hsfs and Hsps to a range of abiotic and biotic stress treatments (heat, cold, osmotic stress, salt, drought, genotoxic stress, ultraviolet light, oxidative stress, wounding, and pathogen infection) in both above and below-ground plant tissues.

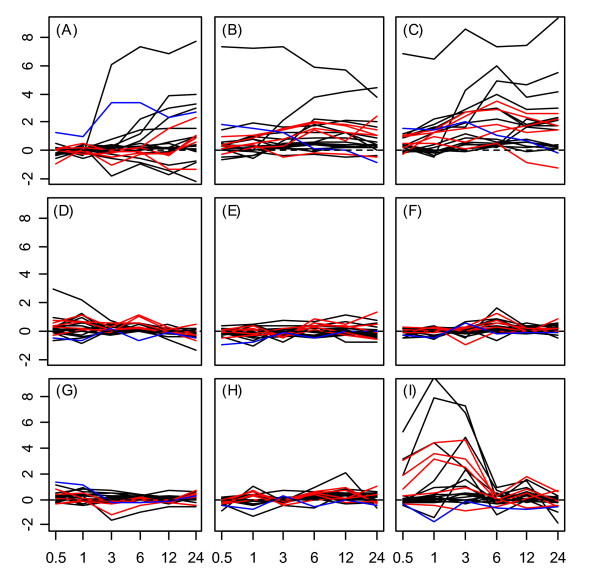
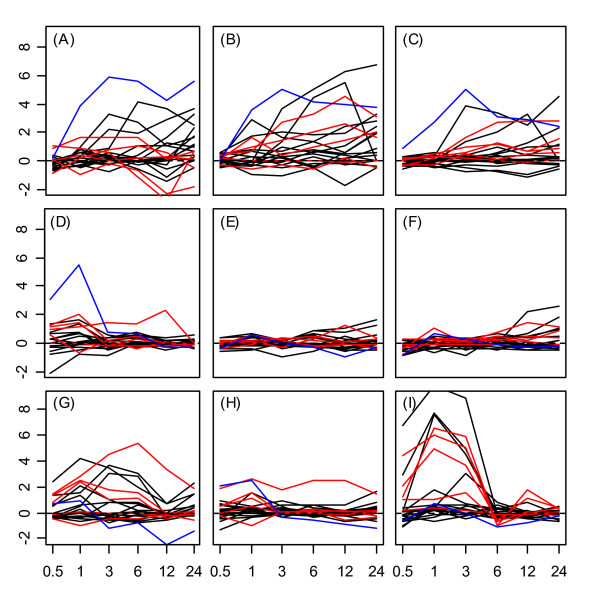
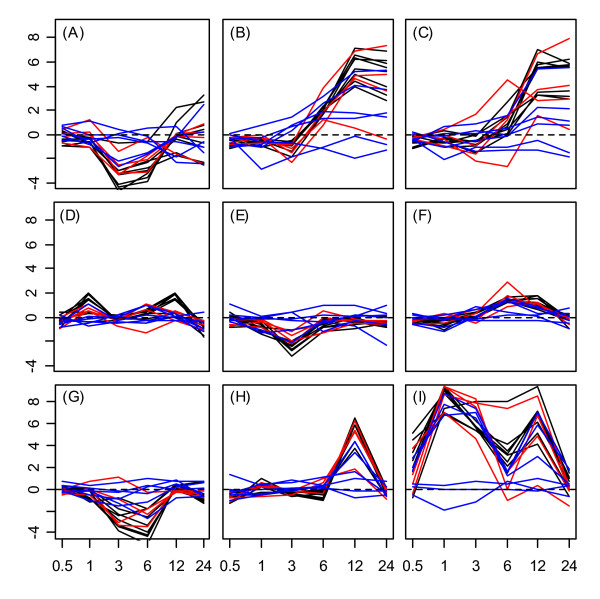
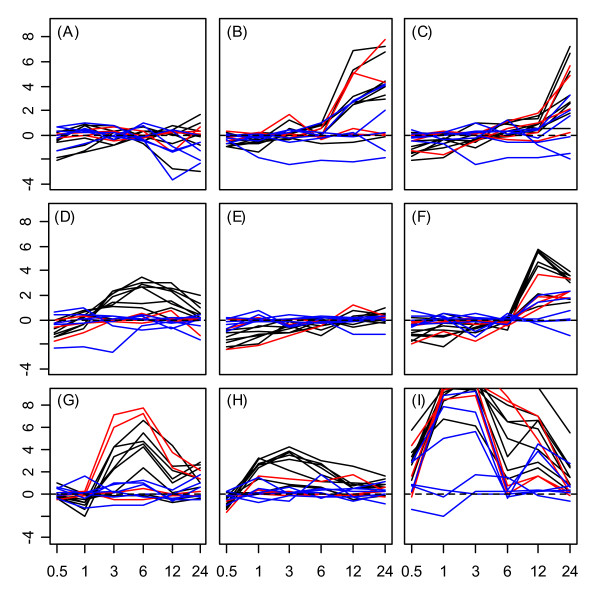
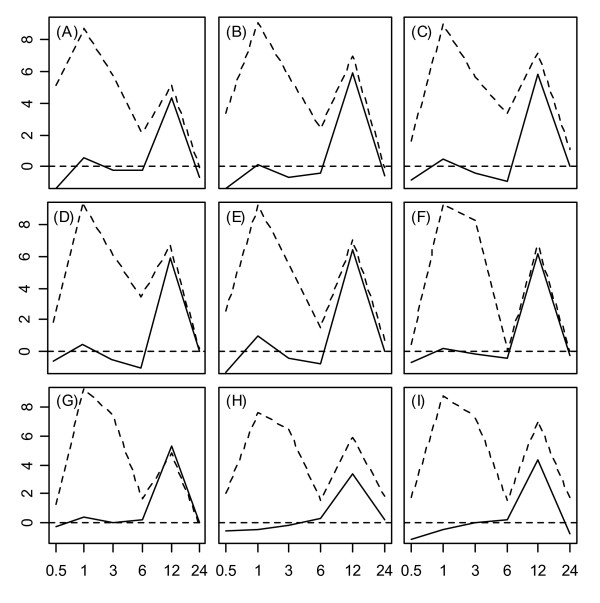
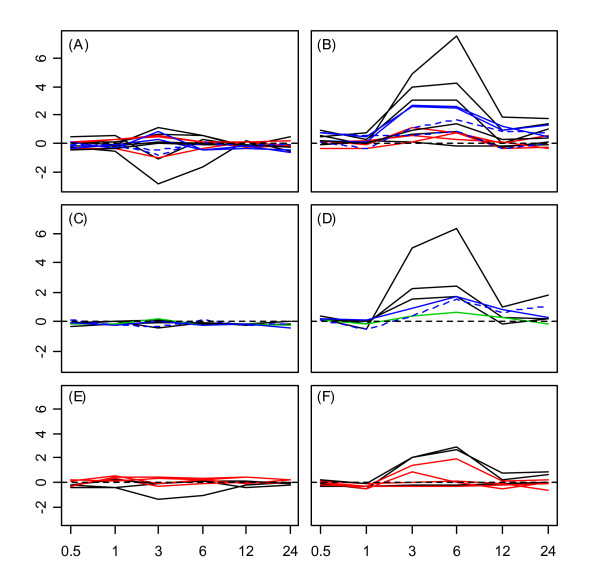
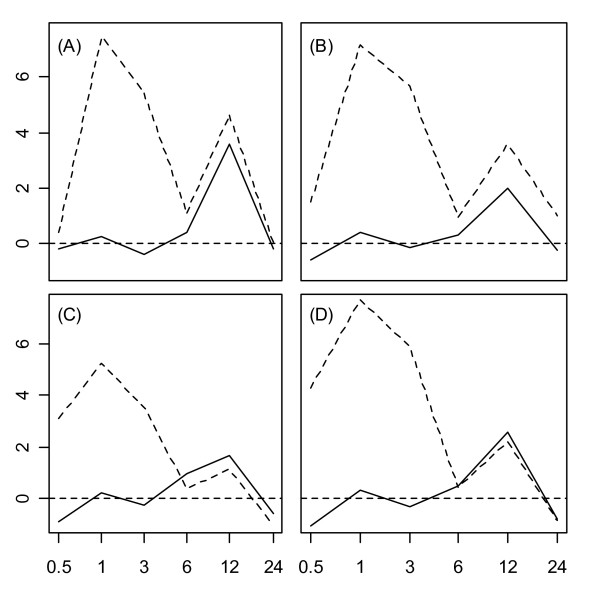
Results: All stress treatments interact with Hsf and Hsp response pathways to varying extents, suggesting considerable cross-talk between heat and non-heat stress regulatory networks. In general, Hsf and Hsp expression was strongly induced by heat, cold, salt, and osmotic stress, while other types of stress exhibited family or tissue-specific response patterns. With respect to the Hsp20 protein family, for instance, large expression responses occurred under all types of stress, with striking similarity among expression response profiles. Several genes belonging to the Hsp20, Hsp70 and Hsp100 families were specifically upregulated twelve hours after wounding in root tissue, and exhibited a parallel expression response pattern during recovery from heat stress. Among all Hsf and Hsp families, large expression responses occurred under ultraviolet-B light stress in aerial tissue (shoots) but not subterranean tissue (roots).

Conclusion: Our findings show that Hsf and Hsp family member genes represent an interaction point between multiple stress response pathways, and therefore warrant functional analysis under conditions apart from heat shock treatment. In addition, our analysis revealed several family and tissue-specific heat shock gene expression patterns that have not been previously described. These results have implications regarding the molecular basis of cross-tolerance in plant species, and raise new questions to be pursued in future experimental studies of the Arabidopsis heat shock response network.


Figures

Figure 1
Figure 1
Heat shock transcription factor expression response profiles in roots. Expression response profiles associated with heat shock transcription factors under (A) cold stress, (B) osmotic stress, (C) salt stress, (D) drought, (E) genotoxic stress, (F) oxidative stress, (G) ultraviolet-b light, (H) wounding, and (I) heat in root tissue. Class A, B, and C transcription factors are represented by black, red, and blue lines, respectively. The horizontal axis of each subplot corresponds to time points at which gene expression measurements were obtained under each stress treatment (0.5, 1, 3, 6, and 12 hrs.). The vertical axis of each subplot indicates the log2 fold-change associated with each Hsf under a given stress treatment.
Figure 2
Figure 2
Heat shock transcription factor expression response profiles in shoots. Expression response profiles associated with heat shock transcription factors in shoot tissue. See Figure 1 caption.
Figure 3
Figure 3
Hsp20 expression response profiles in roots. Expression response profiles associated with Hsp20 proteins under (A) cold stress, (B) osmotic stress, (C) salt stress, (D) drought, (E) genotoxic stress, (F) oxidative stress, (G) ultraviolet-b light, (H) wounding, and (I) heat in root tissue. The cytoplasmic/nuclear Hsp20s (classes I – III) are represented by black lines. Plastidial, endoplasmic reticulum, and mitochondrial Hsp20s (classes P, ER, and M) are represented by red lines. Class I and Class P related Hsp20s are indicated by blue lines. The horizontal axis of each subplot corresponds to time points at which gene expression measurements were available under each stress treatment (0.5, 1, 3, 6, and 12 hrs.). The vertical axis of each subplot indicates log2 fold-change under a given stress treatment. A dotted horizontal line in each plot indicates a log2 fold-change of zero (no expression response to stress).
Figure 4
Figure 4
Hsp20 expression response profiles in shoots. Expression response profiles associated with Hsp20 proteins in shoot tissue.
Figure 5
Figure 5
Expression response profiles of select Hsp20 genes under wounding and heat stress treatments. Expression response profiles of nine selected Hsp20 proteins under wounding (solid line) and heat (dotted line) treatments are shown. Subplots display response profiles associated with (A) 17.6A-CI, (B) 17.4-CI, (C) 17.6C-CI, (D) 17.6-CII, (E) 17.7-CII, (F) 25.4-P, (G) 23.6-M, (H) 15.7-CI(r), and (I) 26.5-P(r). The horizontal axis corresponds to time points at which gene expression measurements were obtained, while the vertical axis indicates the log2 fold-change. The dotted horizontal line in each plot indicates a log2 fold-change of zero (no expression response to stress). For the heat stress treatment, roots were exposed to heat until the 3 hr. time point, such that the 3–24 hr time interval represents a recovery period.
Figure 6
Figure 6
Hsp70, Hsp90 and Hsp100 expression response profiles under ultraviolet-B light stress treatment. Expression response profiles associated with all members of the Hsp70 family (A and B), Hsp90 family (C and D), and Hsp100 family (E and F). Profiles associated with root tissue are shown in A, C, and E, while expression response profiles associated with shoot tissue are shown in B, D, and F. The horizontal axis corresponds to time points at which genes expression measurements were obtained, while the vertical axis indicates the log2 fold-change. The dotted horizontal line in each plot indicates a log2 fold-change of zero (no expression response to UV-B light). Hsps were localized to the cytoplasm (black lines), plastid (red lines), chloroplast (green line), mitochondria (blue lines), or endoplasmic reticulum (dashed blue line).
Figure 7
Figure 7
Expression response profiles of selected Hsp70, Hsp90 and Hsp100 genes under wounding and heat stress treatments. Expression response profiles of four selected proteins (Hsp70, Hsp90, or Hsp100) under wounding (solid line) and heat (dotted line) treatments are shown. Subplots display response profiles associated with (A) AtHsp70-5, (B) AtHsp70-8, (C) AtHsp90-1, and (D) AtHsp100-1. The horizontal axis corresponds to time points at which gene expression measurements were obtained, while the vertical axis indicates the log2 fold-change. The dotted horizontal line in each plot indicates a log2 fold-change of zero (no expression response to stress). For the heat stress treatment, roots were exposed to heat until the 3 hr. time point, such that the 3–24 hr time interval represents a recovery period.

References

    1. Nover L, Bharti K, Döring P, Mishra SK, Ganguli A, Scharf K-D. Arabidopsis and the heat stress transcription factor world: how many heat stress transcription factors do we need? Cell Stress Chaperones. 2001;6:177–189. - PMC - PubMed
    1. Sung DY, Kaplan F, Lee K-J, Guy GL. Acquired tolerance to temperature extremes. Trends Plant Sci. 2003;8:179–187. - PubMed
    1. Larkindale J, Hall JD, Knight MR, Vierling E. Heat stress phenotypes of Arabidopsis mutants implicate multiple signaling pathways in the acquisition of thermotolerance. Plant Physiol. 2005;138:882–897. - PMC - PubMed
    1. Cheong Y, Chang H, Gupta R, Wang X, Zhu T, Luan S. Transcriptional profiling reveals novel interactions between wounding, pathogen, abiotic stress, and hormonal response in Arabidopsis. Plant Physiol. 2002;129:661–677. - PMC - PubMed
    1. Rensink WA, Lobst S, Hart A, Stegalkina S, Liu J, Buell CR. Gene expression profiling of potato responses to cold, heat, and salt stress. Funct Integ Genom. 2005;5:201–207. - PubMed

Publication types

MeSH terms

LinkOut - more resources