

Global and regional drivers of accelerating CO2 emissions
- PMID: 17519334
- PMCID: PMC1876160
- DOI: 10.1073/pnas.0700609104
Global and regional drivers of accelerating CO2 emissions
Abstract
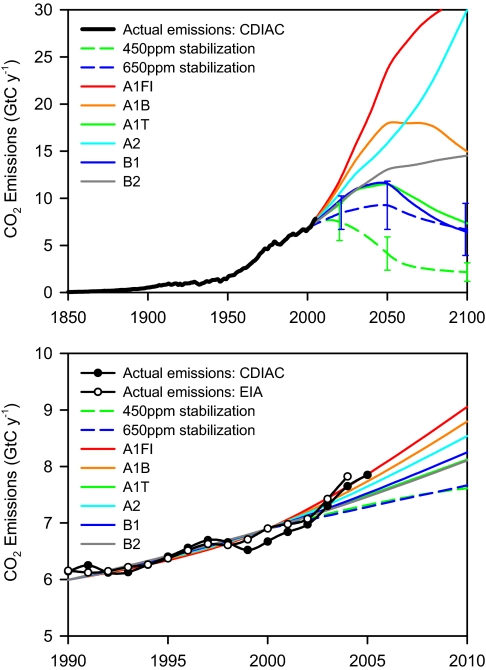
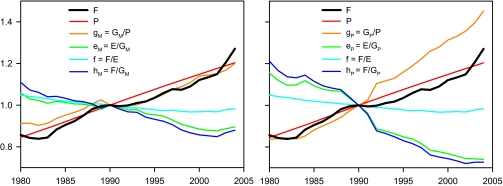
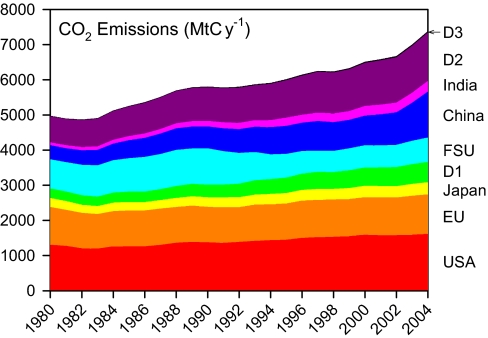
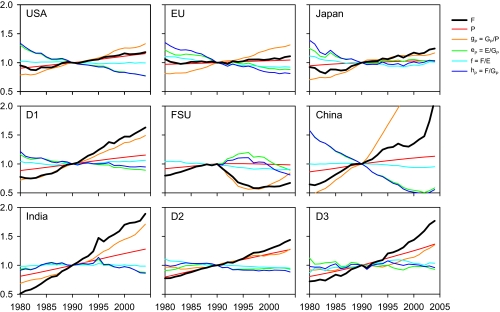
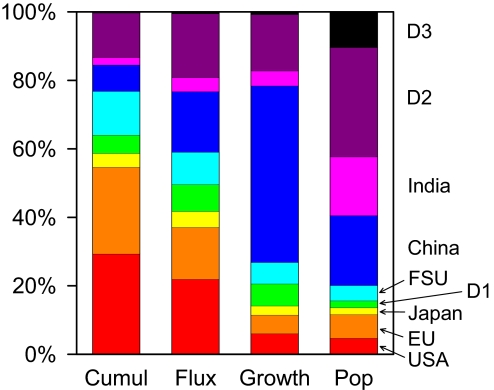
CO2 emissions from fossil-fuel burning and industrial processes have been accelerating at a global scale, with their growth rate increasing from 1.1% y(-1) for 1990-1999 to >3% y(-1) for 2000-2004. The emissions growth rate since 2000 was greater than for the most fossil-fuel intensive of the Intergovernmental Panel on Climate Change emissions scenarios developed in the late 1990s. Global emissions growth since 2000 was driven by a cessation or reversal of earlier declining trends in the energy intensity of gross domestic product (GDP) (energy/GDP) and the carbon intensity of energy (emissions/energy), coupled with continuing increases in population and per-capita GDP. Nearly constant or slightly increasing trends in the carbon intensity of energy have been recently observed in both developed and developing regions. No region is decarbonizing its energy supply. The growth rate in emissions is strongest in rapidly developing economies, particularly China. Together, the developing and least-developed economies (forming 80% of the world's population) accounted for 73% of global emissions growth in 2004 but only 41% of global emissions and only 23% of global cumulative emissions since the mid-18th century. The results have implications for global equity.
Conflict of interest statement
The authors declare no conflict of interest.
Figures
References
-
- Hofmann DJ, Butler JH, Dlugokencky EJ, Elkins JW, Masarie K, Montzka SA, Tans P. Tellus Ser B. 2006;58:614–619.
-
- Etheridge DM, Steele LP, Langenfelds RL, Francey RJ, Barnola JM, Morgan VI. J Geophys Res Atmos. 1996;101:4115–4128.
-
- Raupach MR, Canadell JG. In: Observing the Continental Scale Greenhouse Gas Balance of Europe. Dolman H, Valentini R, Freibauer A, editors. Berlin: Springer; 2007. in press.
-
- Sabine CL, Heimann M, Artaxo P, Bakker DCE, Chen C-TA, Field CB, Gruber N, Le Quéré C, Prinn RG, Richey JD, et al. In: The Global Carbon Cycle: Integrating Humans, Climate, and the Natural World. Field CB, Raupach MR, editors. Washington, DC: Island; 2004. pp. 17–44.
-
- Hoffert MI, Caldeira K, Benford G, Criswell DR, Green C, Herzog H, Jain AK, Kheshgi HS, Lackner KS, Lewis JS, et al. Science. 2002;298:981–987. - PubMed
Publication types
MeSH terms
Substances
LinkOut - more resources
Full Text Sources
Other Literature Sources
Research Materials
