. 2007 May 29;104(22):9404-9.
doi: 10.1073/pnas.0609457104. Epub 2007 May 22.

Density-equalizing Euclidean minimum spanning trees for the detection of all disease cluster shapes

Affiliations

Density-equalizing Euclidean minimum spanning trees for the detection of all disease cluster shapes

Shannon C Wieland et al. Proc Natl Acad Sci U S A. .

Abstract

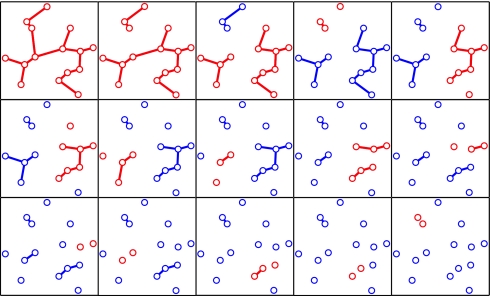
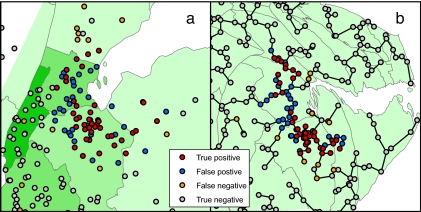
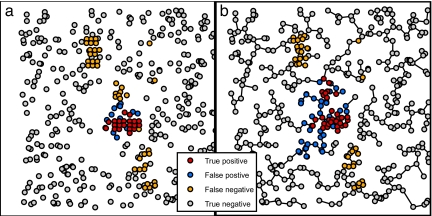
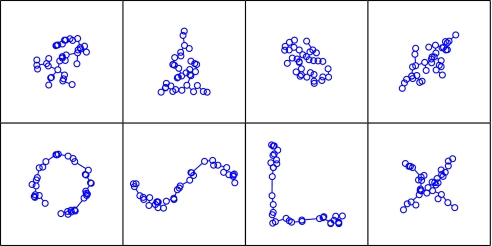
Existing disease cluster detection methods cannot detect clusters of all shapes and sizes or identify highly irregular sets that overestimate the true extent of the cluster. We introduce a graph-theoretical method for detecting arbitrarily shaped clusters based on the Euclidean minimum spanning tree of cartogram-transformed case locations, which overcomes these shortcomings. The method is illustrated by using several clusters, including historical data sets from West Nile virus and inhalational anthrax outbreaks. Sensitivity and accuracy comparisons with the prevailing cluster detection method show that the method performs similarly on approximately circular historical clusters and greatly improves detection for noncircular clusters.


Conflict of interest statement

The authors declare no conflict of interest.

Figures

Fig. 1.
Fig. 1.
Procedure to locate potential clusters illustrated for a set of 15 cases. The EMST is first constructed (Top Left). This is a tree connecting each case (circle) that minimizes the total summed edge distance. At each step, the longest remaining edge is deleted, forming two new connected components (red). Components that were unchanged from the previous step are shown in blue. The connected components are in one-to-one correspondence with the set of potential clusters.
Fig. 2.
Fig. 2.
Detection of 1999 New York West Nile virus cases by SaTScan and the EMST method. (a) A typical data set consisting of the 56 West Nile virus cases (red and orange) and 400 background cases (blue and gray) are shown on a map of Connecticut, New Jersey, and New York. Only part of the map is shown for clarity. The West Nile virus case locations have been randomly skewed for privacy (34). The most likely cluster identified by SaTScan is shown (red and blue). The green shading represents the density of controls in each county. (b) The Voronoi diagram cartogram of part of the study area is shown along with the transformed case locations. Although the Voronoi diagram cartogram regions are not shown, the distortion of county boundaries induced by the cartogram transformation is apparent. The minimum spanning tree (black edges) connects the most likely cluster identified by the EMST method (red and blue). The control density varies by <2.0% over the entire map.
Fig. 3.
Fig. 3.
SaTScan and EMST detection of 1979 Sverdlovsk anthrax outbreak. (a) A representative data set of 63 anthrax cases (red and orange) and 400 uniformly distributed background cases (blue and gray) is shown, along with the most likely cluster determined by SaTScan (red and blue). (b) The EMST method most likely cluster (red and blue) is shown for the same data set, connected by the minimum spanning tree of the cartogram-transformed cases (black edges).
Fig. 4.
Fig. 4.
Equally detectable potential clusters of various shapes. A most likely cluster of 35 points selected from among the Boston circular cluster data sets, along with its minimum spanning tree, is shown in the upper left. Seven other configurations of 35 points, having minimum spanning trees with exactly the same weight, are also shown. Subject to the constraint imposed by the definition of a potential cluster, all eight clusters have equivalent detectability by the EMST method. If embedded as potential clusters in a Boston data set of 500 total cases, all would achieve the same P value of 0.0001.

References

    1. Besag J, Newell J. J R Stat Soc A. 1991;154:143–155.
    1. Meselson M, Guillemin J, Hugh-Jones M, Langmuir A, Popova I, Shelokov A, Yampolskaya O. Science. 1994;266:1202–1208. - PubMed
    1. Ruiz MO, Tedesco C, McTighe TJ, Austin C, Kitron U. Int J Health Geogr. 2004;3:8. - PMC - PubMed
    1. Diggle P. J R Stat Soc A. 1990;153:349–362.
    1. Keeling MJ, Woolhouse MEJ, Shaw DJ, Matthews L, Chase-Topping M, Haydon DT, Cornell SJ, Kappey J, Wilesmith J, Grenfell BT. Science. 2001;294:813–817. - PubMed

Publication types