Virtual Northern analysis of the human genome
- PMID: 17520019
- PMCID: PMC1866243
- DOI: 10.1371/journal.pone.0000460
Virtual Northern analysis of the human genome
Abstract
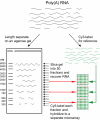
Background: We applied the Virtual Northern technique to human brain mRNA to systematically measure human mRNA transcript lengths on a genome-wide scale.
Methodology/principal findings: We used separation by gel electrophoresis followed by hybridization to cDNA microarrays to measure 8,774 mRNA transcript lengths representing at least 6,238 genes at high (>90%) confidence. By comparing these transcript lengths to the Refseq and H-Invitational full-length cDNA databases, we found that nearly half of our measurements appeared to represent novel transcript variants. Comparison of length measurements determined by hybridization to different cDNAs derived from the same gene identified clones that potentially correspond to alternative transcript variants. We observed a close linear relationship between ORF and mRNA lengths in human mRNAs, identical in form to the relationship we had previously identified in yeast. Some functional classes of protein are encoded by mRNAs whose untranslated regions (UTRs) tend to be longer or shorter than average; these functional classes were similar in both human and yeast.
Conclusions/significance: Human transcript diversity is extensive and largely unannotated. Our length dataset can be used as a new criterion for judging the completeness of cDNAs and annotating mRNA sequences. Similar relationships between the lengths of the UTRs in human and yeast mRNAs and the functions of the proteins they encode suggest that UTR sequences serve an important regulatory role among eukaryotes.
Conflict of interest statement
Figures


References
-
- Lander ES, Linton LM, Birren B, Nusbaum C, Zody MC, et al. Initial sequencing and analysis of the human genome. Nature. 2001;409:860–921. - PubMed
-
- Venter JC, Adams MD, Myers EW, Li PW, Mural RJ, et al. The sequence of the human genome. Science. 2001;291:1304–1351. - PubMed
-
- International Human Genome Sequencing Consortium. Finishing the euchromatic sequence of the human genome. Nature. 2004;431:931–45. - PubMed
-
- Suzuki Y, Yoshitomo-Nakagawa K, Maruyama K, Suyama A, Sugano S. Construction and characterization of a full length-enriched and a 5′-end-enriched cDNA library. Gene. 1997;200:149–56. - PubMed
Publication types
MeSH terms
Substances
Grants and funding
LinkOut - more resources
Full Text Sources

