

Evaluation of individual particle capillary electrophoresis experiments via quantile analysis
- PMID: 17521658
- PMCID: PMC2504414
- DOI: 10.1016/j.chroma.2007.04.065
Evaluation of individual particle capillary electrophoresis experiments via quantile analysis
Abstract
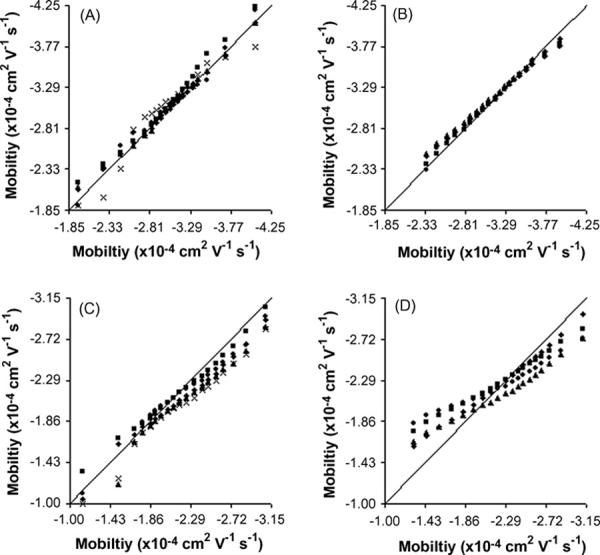
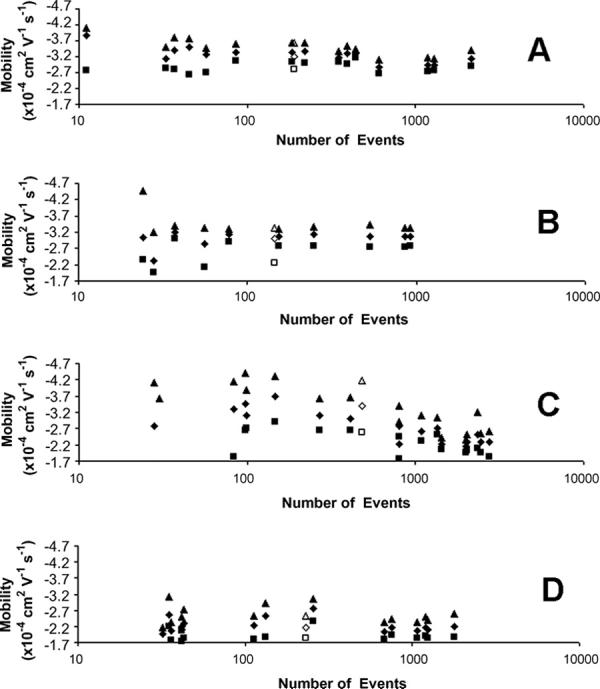
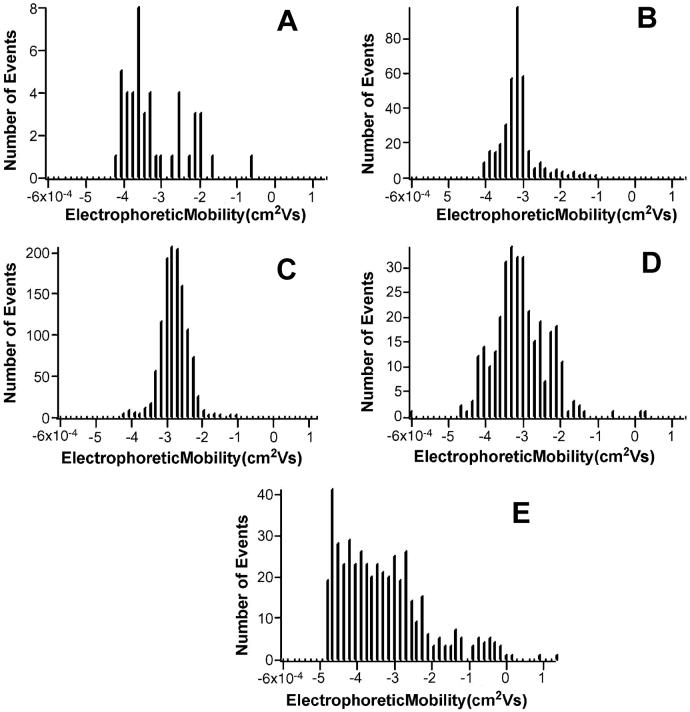
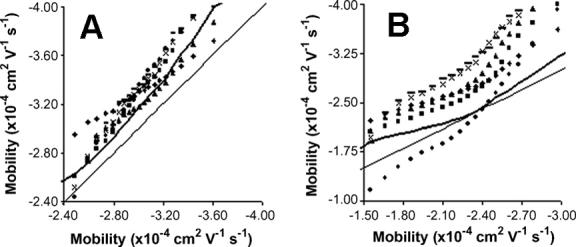
The number of particles in a sample heavily influences the shape of a distribution corresponding to the individual particle measurements. Selecting an adequate number of particles that prevents biases due to sample size is particularly difficult for complex biological systems in which statistical distributions are not normal. Quantile analysis is a powerful statistical technique that can rapidly compare differences between multiple distributions of individual particles. This report utilizes quantile analysis to show that the number of events detected affects the mobility distributions for rat liver and mouse liver mitochondria, sample individual particles, when analyzed via capillary electrophoresis with laser-induced fluorescence. When the mitochondrial sample is small (e.g. <78), there are not enough events to obtain statistically relevant mobility data. Adsorption to the capillary surface also significantly affects the mobility distribution at a small number of events in uncoated and dynamically coated capillaries. These adsorption effects can be overcome when the mitochondrial load on the capillary is sufficiently large (i.e. >609 and >1426 events for mouse liver on uncoated capillaries and rat liver on dynamically coated capillaries, respectively). It is anticipated that quantile analysis can be used to study other distributions of individual particles, such as nanoparticles, organelles, and biomolecules, and that distributions of these particles will also be dependent on sample size.
Figures
References
-
- Zhu A, Chen YJ. J. Chromatogr. 1989;470:251. - PubMed
-
- Hjertén S, Elenbring K, Kilar F, Liao JL, Chen AJ, Siebert CJ, Zhu MD. J. Chromatogr. 1987;403:47. - PubMed
-
- Grossman PD, Soane DS. Anal. Chem. 1990;62:1592. - PubMed
-
- Ebersole RC, McCormick RM. Biotechnology. 1993;11:1278. - PubMed
-
- Armstrong DW, Schulte G, Schneiderheinze JM, Westenberg DJ. Anal. Chem. 1999;71:5465. - PubMed
Publication types
MeSH terms
Grants and funding
LinkOut - more resources
Full Text Sources
