The Y-encoded TSPY protein: a significant marker potentially plays a role in the pathogenesis of testicular germ cell tumors
- PMID: 17521702
- PMCID: PMC2744854
- DOI: 10.1016/j.humpath.2007.03.011
The Y-encoded TSPY protein: a significant marker potentially plays a role in the pathogenesis of testicular germ cell tumors
Abstract
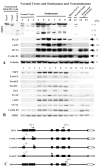
The testis-specific protein Y-encoded (TSPY) gene is the putative gene for the gonadoblastoma locus on the Y chromosome (GBY) that predisposes dysgenetic gonads of intersex patients to gonadoblastoma development. TSPY is expressed at high levels in gonadoblastoma tissues, supporting its possible oncogenic function in this type of germ cell tumors. To explore the possibility that this Y chromosome gene is also involved in pathogenesis of the more common testicular germ cell tumors (TGCTs), we have conducted various expression studies using immunohistochemistry, Western blotting, and reverse transcription-polymerase chain reaction analysis on 171 cases of TGCTs and selected normal testis controls. Our results demonstrated that TSPY protein is abundantly expressed in the precursor, carcinoma in situ or intratubular germ cell neoplasia unclassified, and seminoma, but only minimally or not expressed in various types of nonseminomas. TSPY coexpresses with established germ cell tumor markers (such as placental-like alkaline phosphatase, c-KIT, OCT4) and proliferative markers (such as Ki-67 and cyclin B1) in the same tumor cells at both RNA and protein levels. Ectopic TSPY expression in cultured cells up-regulates progrowth genes, including those at chromosome 12p13, frequently gained/amplified in TGCTs. Our results suggest that TSPY, in combination with other markers, could be an important marker for diagnosis and subclassification of TGCTs and support its role in the pathogenesis of both gonadoblastoma and TGCTs.
Figures


Similar articles
-
Testis-specific protein Y-encoded gene is expressed in early and late stages of gonadoblastoma and testicular carcinoma in situ.Urol Oncol. 2007 Mar-Apr;25(2):141-6. doi: 10.1016/j.urolonc.2006.08.002. Urol Oncol. 2007. PMID: 17349529
-
Gonadoblastoma locus and the TSPY gene on the human Y chromosome.Birth Defects Res C Embryo Today. 2009 Mar;87(1):114-22. doi: 10.1002/bdrc.20144. Birth Defects Res C Embryo Today. 2009. PMID: 19306348 Review.
-
Gonadoblastoma Y locus genes expressed in germ cells of individuals with dysgenetic gonads and a Y chromosome in their karyotypes include DDX3Y and TSPY.Hum Reprod. 2019 Apr 1;34(4):770-779. doi: 10.1093/humrep/dez004. Hum Reprod. 2019. PMID: 30753444
-
Testis-specific protein on Y chromosome (TSPY) represses the activity of the androgen receptor in androgen-dependent testicular germ-cell tumors.Proc Natl Acad Sci U S A. 2010 Nov 16;107(46):19891-6. doi: 10.1073/pnas.1010307107. Epub 2010 Nov 1. Proc Natl Acad Sci U S A. 2010. Retraction in: Proc Natl Acad Sci U S A. 2014 Feb 11;111(6):2398. doi: 10.1073/pnas.1323399111. PMID: 21041627 Free PMC article. Retracted.
-
Germ cell tumors of the gonads: a selective review emphasizing problems in differential diagnosis, newly appreciated, and controversial issues.Mod Pathol. 2005 Feb;18 Suppl 2:S61-79. doi: 10.1038/modpathol.3800310. Mod Pathol. 2005. PMID: 15761467 Review.
Cited by
-
Long-term vitamin A deficiency induces alteration of adult mouse spermatogenesis and spermatogonial differentiation: direct effect on spermatogonial gene expression and indirect effects via somatic cells.J Nutr Biochem. 2013 Jun;24(6):1123-35. doi: 10.1016/j.jnutbio.2012.08.013. Epub 2012 Dec 17. J Nutr Biochem. 2013. PMID: 23253600 Free PMC article.
-
Roles of the Y chromosome genes in human cancers.Asian J Androl. 2015 May-Jun;17(3):373-80. doi: 10.4103/1008-682X.150842. Asian J Androl. 2015. PMID: 25814157 Free PMC article. Review.
-
Genomic alterations in patients with somatic loss of the Y chromosome as the sole cytogenetic finding in bone marrow cells.Haematologica. 2021 Feb 1;106(2):555-564. doi: 10.3324/haematol.2019.240689. Haematologica. 2021. PMID: 32193254 Free PMC article.
-
Errors in RNA-Seq quantification affect genes of relevance to human disease.Genome Biol. 2015 Sep 3;16(1):177. doi: 10.1186/s13059-015-0734-x. Genome Biol. 2015. PMID: 26335491 Free PMC article.
-
[Advances in basic research on testicular germ cell tumors : clinical implications].Urologe A. 2009 Apr;48(4):350-8. doi: 10.1007/s00120-009-1948-x. Urologe A. 2009. PMID: 19352605 Review. German.
References
-
- Zhang JS, Yang-Feng TL, Muller U, Mohandas TK, de Jong PJ, Lau YF. Molecular isolation and characterization of an expressed gene from the human Y chromosome. Hum Mol Genet. 1992;1:717–726. - PubMed
-
- Schnieders F, Dork T, Arnemann J, Vogel T, Werner M, Schmidtke J. Testis-specific protein, Y-encoded (TSPY) expression in testicular tissues. Hum Mol Genet. 1996;5:1801–1807. - PubMed
-
- Skaletsky H, Kuroda-Kawaguchi T, Minx PJ, Cordum HS, Hillier L, Brown LG, Repping S, Pyntikova T, Ali J, Bieri T, Chinwalla A, Delehaunty A, Delehaunty K, Du H, Fewell G, Fulton L, Fulton R, Graves T, Hou SF, Latrielle P, Leonard S, Mardis E, Maupin R, McPherson J, Miner T, Nash W, Nguyen C, Ozersky P, Pepin K, Rock S, Rohlfing T, Scott K, Schultz B, Strong C, Tin-Wollam A, Yang SP, Waterston RH, Wilson RK, Rozen S, Page DC. The male-specific region of the human Y chromosome is a mosaic of discrete sequence classes. Nature. 2003;423:825–837. - PubMed
-
- Page DC. Hypothesis: a Y-chromosomal gene causes gonadoblastoma in dysgenetic gonads. Development. 1987;101 Suppl:151–155. - PubMed
-
- Salo P, Kaariainen H, Petrovic V, Peltomaki P, Page DC, de la Chapelle A. Molecular mapping of the putative gonadoblastoma locus on the Y chromosome. Genes Chromosomes Cancer. 1995;14:210–214. - PubMed
Publication types
MeSH terms
Substances
Grants and funding
LinkOut - more resources
Full Text Sources
Medical

