

Early blood profiles of virus infection in a monkey model for Lassa fever
- PMID: 17522210
- PMCID: PMC1951294
- DOI: 10.1128/JVI.00536-07
Early blood profiles of virus infection in a monkey model for Lassa fever
Abstract
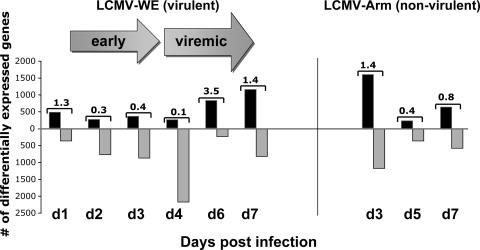
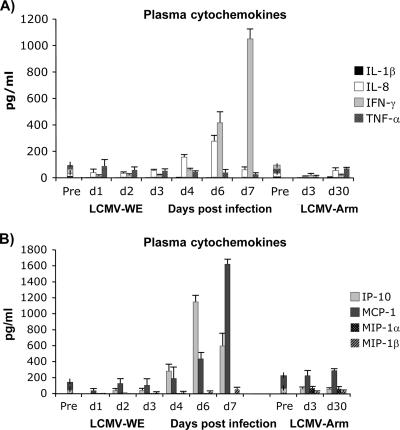
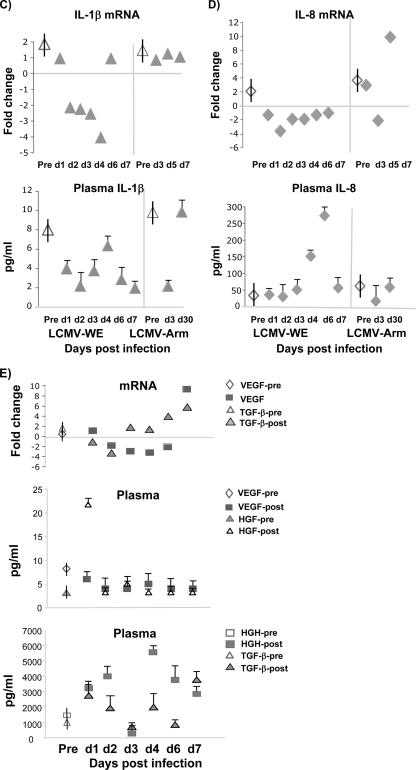
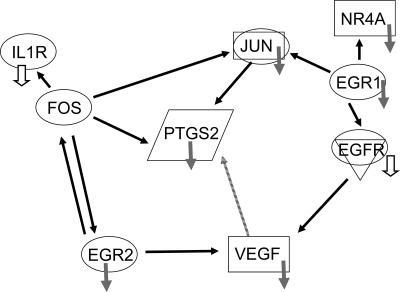
Acute arenavirus disease in primates, like Lassa hemorrhagic fever in humans, begins with flu-like symptoms and leads to death approximately 2 weeks after infection. Our goal was to identify molecular changes in blood that are related to disease progression. Rhesus macaques (Macaca mulatta) infected intravenously with a lethal dose of lymphocytic choriomeningitis virus (LCMV) provide a model for Lassa virus infection of humans. Blood samples taken before and during the course of infection were used to monitor gene expression changes that paralleled disease onset. Changes in blood showed major disruptions in eicosanoid, immune response, and hormone response pathways. Approximately 12% of host genes alter their expression after LCMV infection, and a subset of these genes can discriminate between virulent and non-virulent LCMV infection. Major transcription changes have been given preliminary confirmation by quantitative PCR and protein studies and will be valuable candidates for future validation as biomarkers for arenavirus disease.
Figures
Similar articles
-
Lymphocytic choriomeningitis virus (LCMV) infection of macaques: a model for Lassa fever.Antiviral Res. 2011 Nov;92(2):125-38. doi: 10.1016/j.antiviral.2011.07.015. Epub 2011 Jul 27. Antiviral Res. 2011. PMID: 21820469 Free PMC article. Review.
-
Delayed inflammatory and cell death responses are associated with reduced pathogenicity in Lujo virus-infected cynomolgus macaques.J Virol. 2015 Mar;89(5):2543-52. doi: 10.1128/JVI.02246-14. Epub 2014 Dec 17. J Virol. 2015. PMID: 25520505 Free PMC article.
-
Gene expression in primate liver during viral hemorrhagic fever.Virol J. 2009 Feb 12;6:20. doi: 10.1186/1743-422X-6-20. Virol J. 2009. PMID: 19216742 Free PMC article.
-
Circulating natural killer and gammadelta T cells decrease soon after infection of rhesus macaques with lymphocytic choriomeningitis virus.Mem Inst Oswaldo Cruz. 2009 Jul;104(4):583-91. doi: 10.1590/s0074-02762009000400009. Mem Inst Oswaldo Cruz. 2009. PMID: 19722081
-
A Primate Model for Viral Hemorrhagic Fever.Methods Mol Biol. 2018;1604:279-290. doi: 10.1007/978-1-4939-6981-4_22. Methods Mol Biol. 2018. PMID: 28986843 Review.
Cited by
-
Arenavirus evasion of host anti-viral responses.Viruses. 2012 Oct 17;4(10):2182-96. doi: 10.3390/v4102182. Viruses. 2012. PMID: 23202459 Free PMC article. Review.
-
Advanced vaccine candidates for Lassa fever.Viruses. 2012 Oct 29;4(11):2514-57. doi: 10.3390/v4112514. Viruses. 2012. PMID: 23202493 Free PMC article. Review.
-
Pathogenic Old World arenaviruses inhibit TLR2/Mal-dependent proinflammatory cytokines in vitro.J Virol. 2012 Jul;86(13):7216-26. doi: 10.1128/JVI.06508-11. Epub 2012 Apr 24. J Virol. 2012. PMID: 22532679 Free PMC article.
-
Comparative pathogenesis and systems biology for biodefense virus vaccine development.J Biomed Biotechnol. 2010;2010:236528. doi: 10.1155/2010/236528. Epub 2010 Jun 6. J Biomed Biotechnol. 2010. PMID: 20617142 Free PMC article. Review.
-
Vaccine and adjuvant design for emerging viruses: mutations, deletions, segments and signaling.Bioeng Bugs. 2011 May-Jun;2(3):129-35. doi: 10.4161/bbug.2.3.15367. Epub 2011 May 1. Bioeng Bugs. 2011. PMID: 21637006 Free PMC article. Review.
References
-
- Baas, T., C. R. Baskin, D. L. Diamond, A. Garcia-Sastre, H. Bielefeldt-Ohmann, T. M. Tumpey, M. J. Thomas, V. S. Carter, T. H. Teal, N. Van Hoeven, S. Proll, J. M. Jacobs, Z. R. Caldwell, M. A. Gritsenko, R. R. Hukkanen, D. G. Camp II, R. D. Smith, and M. G. Katze. 2006. An integrated molecular signature of disease: analysis of influenza virus-infected macaques through functional genomics and proteomics. J. Virol. 80:10813-10828. - PMC - PubMed
-
- Basta, S., R. Stoessel, M. Basler, M. van den Broek, and M. Groettrup. 2005. Cross-presentation of the long-lived lymphocytic choriomeningitis virus nucleoprotein does not require neosynthesis and is enhanced via heat shock proteins. J. Immunol. 175:796-805. - PubMed
Publication types
MeSH terms
Substances
Grants and funding
LinkOut - more resources
Full Text Sources
Other Literature Sources
Molecular Biology Databases
