Comparative Study
. 2007 Jun 5;104(23):9794-9.
doi: 10.1073/pnas.0610435104. Epub 2007 May 23.

Quantifying HIV-1 transmission due to contaminated injections

Affiliations
Comparative Study

Quantifying HIV-1 transmission due to contaminated injections

Richard G White et al. Proc Natl Acad Sci U S A. .

Abstract

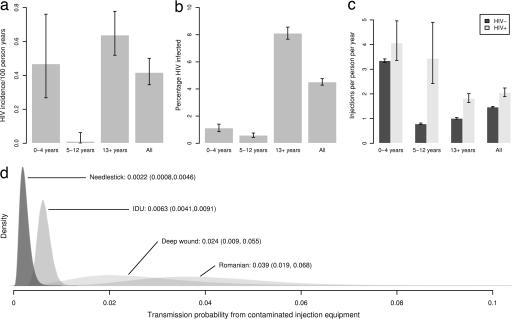
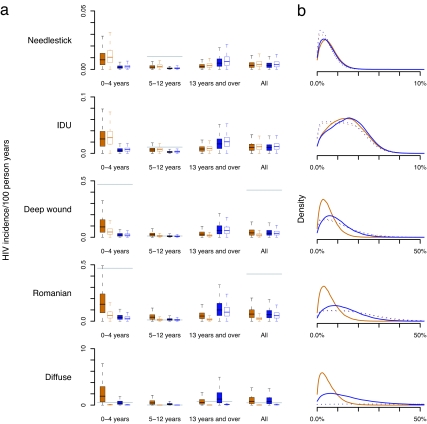
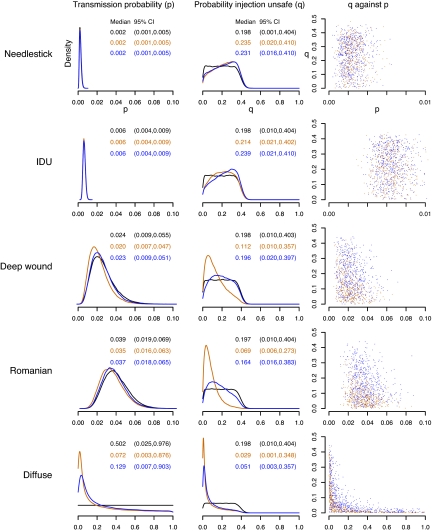
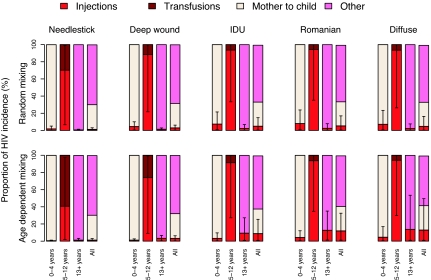
Assessments of the importance of different routes of HIV-1 (HIV) transmission are vital for prioritization of control efforts. Lack of consistent direct data and large uncertainty in the risk of HIV transmission from HIV-contaminated injections has made quantifying the proportion of transmission caused by contaminated injections in sub-Saharan Africa difficult and unavoidably subjective. Depending on the risk assumed, estimates have ranged from 2.5% to 30% or more. We present a method based on an age-structured transmission model that allows the relative contribution of HIV-contaminated injections, and other routes of HIV transmission, to be robustly estimated, both fully quantifying and substantially reducing the associated uncertainty. To do this, we adopt a Bayesian perspective, and show how prior beliefs regarding the safety of injections and the proportion of HIV incidence due to contaminated injections should, in many cases, be substantially modified in light of age-stratified incidence and injection data, resulting in improved (posterior) estimates. Applying the method to data from rural southwest Uganda, we show that the highest estimates of the proportion of incidence due to injections are reduced from 15.5% (95% credible interval) (0.7%, 44.9%) to 5.2% (0.5%, 17.0%) if random mixing is assumed, and from 14.6% (0.7%, 42.5%) to 11.8% (1.2%, 32.5%) under assortative mixing. Lower, and more widely accepted, estimates remain largely unchanged, between 1% and 3% (0.1-6.3%). Although important uncertainty remains, our analysis shows that in rural Uganda, contaminated injections are unlikely to account for a large proportion of HIV incidence. This result is likely to be generalizable to many other populations in sub-Saharan Africa.


Conflict of interest statement

The authors declare no conflict of interest.

Figures

Fig. 1.
Fig. 1.
Principal data and informative prior distributions used for this study. (a) HIV incidence by age in rural Masaka, southwest Uganda (per 100 person-years, 95% credible interval). (b) HIV prevalence by age in Masaka (%, 95% credible interval). (c) Injection rates by HIV infection status and age in Masaka (per person per year, 95% credible interval). (d) Informative prior distributions for the probability of transmission from contaminated unsafe injection equipment (%, p). The median (95% credible interval) for each distribution is shown. Priors were derived from estimates from needlestick injuries (4), injecting drug users (6), needlestick injuries causing deep wounds (1, 7, 8) and nosocomial spread in a Romanian hospital (1). The “noninformative” or Diffuse prior also considered (but not shown) has a median value (95% credible interval) of 50% (2.5%, 97.5%). SeeSI Text for the method of estimating mother-to-child incidence.
Fig. 2.
Fig. 2.
HIV incidence due to unsafe injections. (a) Prior and posterior estimates of HIV incidence due to unsafe injections by age (boxplots show the median, lower, and upper quartiles, and the most extreme points that are no more than 1.5 times the interquartile range from the box). Solid boxes (positions 1 and 3 in each group of 4) show prior results, and open boxes show posterior results (positions 2 and 4 in each group of 4) under random mixing (red) and age-dependent (blue) mixing assumptions. Observed incidence is shown as a gray horizontal line, provided it lies within the range of the y axis. (b) Prior and posterior distributions for the proportion of observed all age incidence explained by unsafe injections. Prior (dotted lines) and posterior (solid lines) distributions are shown for random mixing (red) and age-dependent (blue) mixing of injection equipment. Note differences in axis scales.
Fig. 3.
Fig. 3.
Prior and posterior distributions of the transmission probability from contaminated unsafe injection equipment (p), the probability injection equipment is unsafe (q), and their correlation. Prior (black) and posterior distributions under assumed random mixing of injection equipment (red) and age-dependent mixing (blue) are shown. Medians and 95% credible intervals are shown as text. Scatter-plots of samples from the joint posterior distributions of p and q (column 3) show correlation between parameter estimates for priors with higher values of p. Note differences in axis scales.
Fig. 4.
Fig. 4.
Median proportion of posterior HIV incidence (%) attributable to each route of transmission, by age group. Error bars indicate 95% credible intervals for proportion of incidence due to unsafe injections.

Similar articles

Cited by

References

    1. Gisselquist DP. Int J STD AIDS. 2002;13:152–159. - PubMed
    1. Gisselquist D, Rothenberg R, Potterat J, Drucker E. Int J STD AIDS. 2002;13:657–666. - PubMed
    1. Hauri A, Armstrong G, Hutin Y. Int J STD AIDS. 2004;15:7–16. - PubMed
    1. Baggaley RF, Boily MC, White RG, Alary M. AIDS. 2006;20:805–812. - PubMed
    1. Schmid GP, Buve A, Mugyenyi P, Garnett GP, Hayes RJ, Williams BG, Calleja JG, De Cock KM, Whitworth JA, Kapiga SH, et al. Lancet. 2004;363:482–488. - PubMed

Publication types