Comparative Study
. 2007 May 23;27(21):5559-70.
doi: 10.1523/JNEUROSCI.5117-06.2007.

Linking synaptic plasticity and spike output at excitatory and inhibitory synapses onto cerebellar Purkinje cells

Affiliations
Comparative Study

Linking synaptic plasticity and spike output at excitatory and inhibitory synapses onto cerebellar Purkinje cells

Wolfgang Mittmann et al. J Neurosci. .

Abstract

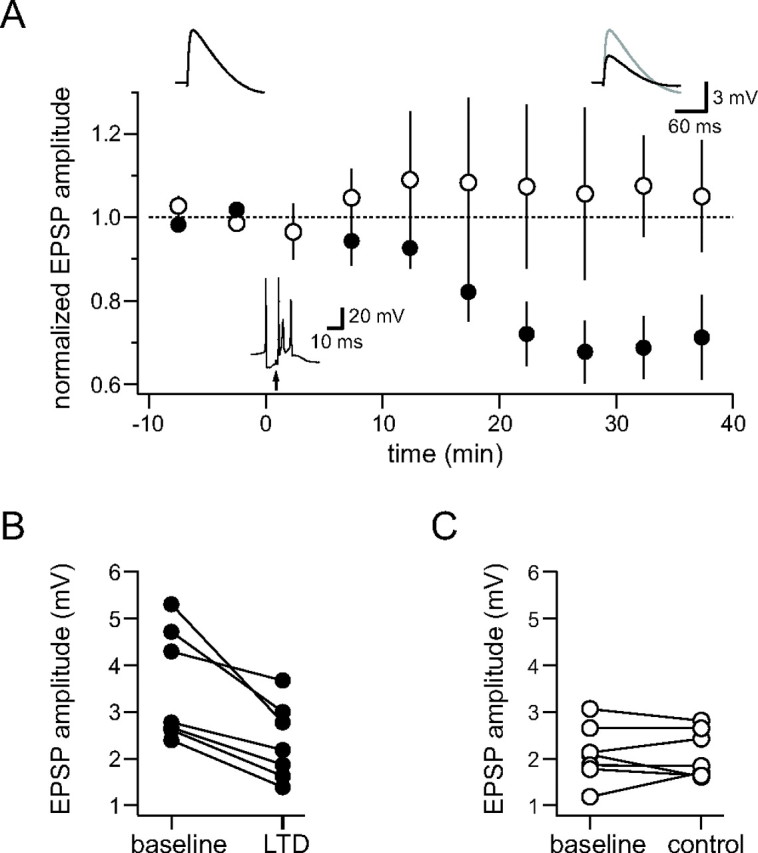
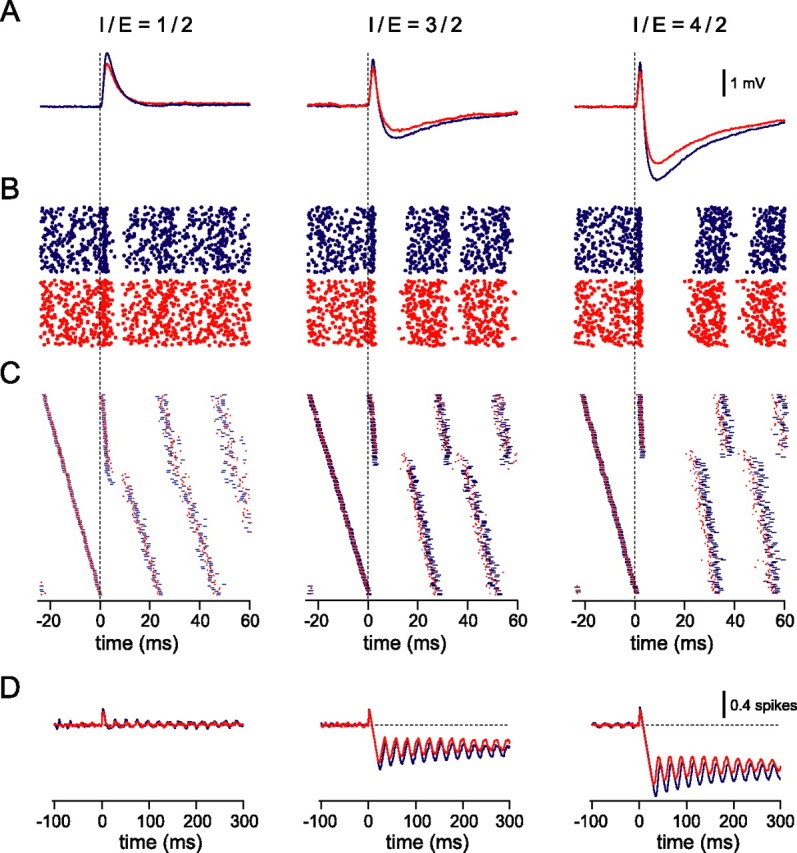
Understanding the relationship between synaptic plasticity and neuronal output is essential if we are to understand how plasticity is encoded in neural circuits. In the cerebellar cortex, motor learning is thought to be implemented by long-term depression (LTD) of excitatory parallel fiber (PF) to Purkinje cell synapses triggered by climbing fiber (CF) input. However, theories of motor learning generally neglect the contribution of plasticity of inhibitory inputs to Purkinje cells. Here we describe how CF-induced plasticity of both excitatory and inhibitory inputs is reflected in Purkinje cell spike output. We show that coactivation of the CF with PF input and interneuron input leads not only to LTD of PF synapses but also to comparable, "balanced" LTD of evoked inhibitory inputs. These two forms of plasticity have opposite effects on the spike output of Purkinje cells, with the number and timing of spikes sensitively reflecting the degree of plasticity. We used dynamic clamp to evaluate plasticity-induced changes in spike responses to sequences of excitation and feedforward inhibition of varied relative and absolute amplitude. Balanced LTD of both excitatory and inhibitory components decreased the net spike output of Purkinje cells only for inputs with small inhibitory components, whereas for inputs with a larger proportion of feedforward inhibition CF-triggered LTD resulted in an increase in the net spike output. Thus, the net effect of CF-triggered plasticity on Purkinje cell output depends on the balance of excitation and feedforward inhibition and can paradoxically increase cerebellar output, contrary to current theories of cerebellar motor learning.


Figures

Figure 1.
Figure 1.
Effect of EPSPs and IPSPs on Purkinje cell spike output. A, B, Schematic illustration of the cerebellar microcircuit, showing stimulation and recording electrodes. When evoking EPSPs (A), inhibition is blocked with bath-applied SR95531. C, An EPSP triggered by parallel fiber stimulation in a whole-cell recording from a cerebellar Purkinje cell (average of 69 sweeps). D, An IPSP evoked by stimulation in the molecular layer (∼100 μm lateral to the Purkinje cell soma) recorded in another Purkinje cell (average of 192 sweeps). In the top traces, the Purkinje cell was hyperpolarized by current injection to −65 mV to suppress spontaneous spiking, and the bottom traces represent 10 superimposed trials in which the same input was stimulated during spontaneous spiking (i.e., without holding current). E, F, Top, The PSTH calculated from the spiking responses shown in A and B. Middle, The corresponding integrated PSTH with a line (red) fit to the baseline and extrapolated over the entire sweep. The subtraction of the extrapolated line from the integrated PSTH yields the cumulative spike probability (bottom) corrected for spontaneous spiking. G, H, Histogram of the first spikes after the stimulation. The EPSP leads to a very narrow distribution of spikes rapidly after the input (G), whereas the first spikes after the IPSP (H) exhibit a wide range of long latencies. The small initial peak in H represents occasional spontaneous spikes occurring between the stimulus and the onset of the IPSP. The dashed red line indicates the mean ISI. The x-axis scale in G and H is valid for C–H.
Figure 2.
Figure 2.
Relationship between synaptic input and spike output. A, EPSPs evoked by different intensities of parallel fiber stimulation recorded in a Purkinje cell held at −65 mV (averages of 50–80 sweeps). B, In the same cell, the effect of parallel fiber input on the timing of spontaneous spikes depends on the size of the input (trace colors correspond to the same stimulus intensities used in A). C, The corrected cumulative spike output depends on the size of the EPSP. Same cell and color scheme as in A. D, Histogram of the first spike latency normalized by the interspike interval (see Results). The thin line shows the baseline probability of a spontaneous spike (which transitions to 0 at the mean ISI). Note that, as the EPSP amplitude increases, the precision of the first spike increases, whereas its latency decreases. E, Net spike output in response to EPSPs and IPSPs for several experiments. IPSP amplitudes in this and subsequent panels are corrected for driving force differences between −65 mV and the average membrane potential during spontaneous spiking. Connected data points are from the same cell. Note the different slopes of the fits (red lines) for EPSPs and IPSPs. F, Spike shift for the same data shown in E. Note the difference in the slopes of the fits (red lines). G, EPSPs of increasing size led to a decrease in temporal jitter of the first spike. The timing of spikes after IPSPs was more variable, and variability increased with increasing IPSP amplitude.
Figure 3.
Figure 3.
Parallel fiber LTD triggered by coincident climbing fiber input. A, Pairing PF EPSPs with CF input triggers LTD of the PF EPSPs. Filled circles show normalized EPSP amplitudes for seven cells. Open circles show controls (7 cells) in which omission of CF activation (i.e., raised PF stimulation frequency alone) did not lead to LTD. Insets show an example EPSP before and after pairing and the response to CF stimulation. The undershoot after the EPSP in this and other figures is attributable to deactivation of I h (Roth and Häusser, 2001; Williams et al., 2002). B, EPSP amplitude before and after CF pairing shown for individual cells. C, Same as B for the control experiments.
Figure 4.
Figure 4.
LTD of inhibitory input triggered by coincident climbing fiber input. A, Evoked IPSPs underwent LTD when paired with CF stimulation. Filled circles show normalized IPSP amplitudes for 13 cells. Open circles show controls (10 cells) without pairing. Insets show an example of an IPSP before and after pairing and stimulation of the IPSP followed by activation of the CF. The overshoot after the IPSP in this and other figures is attributable to activation of I h (Roth and Häusser, 2001; Williams et al., 2002). B, IPSP amplitude before and after CF pairing shown for individual cells. C, Same as B for the control experiments.
Figure 5.
Figure 5.
Readout of synaptic plasticity by the Purkinje cell spike train. A, Baseline (blue) and conditioned (red) EPSP for a control experiment (left) and an LTD induction experiment (right). Bottom shows the corresponding spike data. The EPSP amplitude stays constant in controls resulting in unchanged spike timing, whereas LTD led to an increase in spike latency. Spikes are truncated for clarity. B, The corrected cumulative spike output stays constant in control and is reduced by LTD. C, Summary data for EPSPs. No significant differences for EPSP amplitude, net spike output, spike shift, and spike precision were observed in control experiments (p > 0.15; n = 7). CF pairing led to LTD of EPSP amplitude and decreased net spike output. The spike shift increased because the first spike latencies got longer for decreasing EPSP amplitudes. Changes were significant compared with baseline (*p < 0.05; **p < 0.01) and compared with control (unpaired t test). LTD also led to a reduction in spike precision. D, Change of the net spike output and spike shift versus the change in EPSP amplitude for plasticity and control experiments. Line fits (red) and statistical analysis reveal a strong correlation (for details, see Results). E, Baseline (blue) and conditioned (red) IPSP in a control experiment (left) and after LTD induction (right). Constant IPSP amplitude in control led to unchanged spike timing. LTD of the IPSPs resulted in decreased spike latencies. F, Although the corrected cumulative spike output did not change in control experiments, it increased toward zero after LTD induction. G, Summary data for IPSPs. After LTD, the normalized net spike output decreased because IPSPs led to negative net spike outputs, which increased toward zero through LTD of inhibition. The spike shift decreased because latencies decreased with smaller IPSPs. Spike precision was not significantly affected by LTD. H, As for EPSPs (D), plasticity of IPSPs is strongly correlated with changes in the spike response.
Figure 6.
Figure 6.
Changes in Purkinje cell spike responses induced by balanced LTD of feedforward inputs. A, Excitatory inputs followed by feedforward inhibition were mimicked by current and conductance injection, respectively. Current injection was adjusted to yield a 3 mV EPSP, which was followed by the IPSP adjusted to different amplitudes. Subthreshold potentials (at −65 mV) of three inputs with different I/E ratios from the same cell are shown for baseline (blue) and LTD (red). Traces are averages of 10–25 sweeps. B, The corresponding spike rasters. The spike rate was adjusted to 40 Hz with direct current injection. C, The same rasters displayed on top of each other. The trials in the raster are ordered according to the time of the last baseline spike. Note the small middle region in which the baseline input but not the depressed input triggers a short latency spike. D, The corrected cumulative spike output. Note that the net spike output is zero for the smallest I/E ratio (left). For higher I/E ratios, LTD leads to an increase in the net spike output (middle and right).
Figure 7.
Figure 7.
LTD of excitation and inhibition can be read out by different features of the spike train. AF, Summary data from five cells with different I/E ratios (AC) or different amplitudes with fixed I/E ratio of 1 (DF). For all panels, statistically significant changes are indicated (*p < 0.05). Bottom shows the ratio of LTD and baseline. A, Increasing inhibition led to decreasing probability of rapidly triggered spikes. LTD at all I/E ratios led to an additional decrease. B, The pause after these rapidly triggered spikes (or the last baseline spike if none was triggered) reflected the size of the inhibitory component and increased with increasing inhibition. LTD of the compound input reduced the duration of the pause. Note that, if no inhibition was present, the pause is shorter than the ISI, consistent with the synaptic data. Dashed lines mark the value expected if the cell does not receive an input. C, The net spike output is positive for small I/E ratios, reversing at intermediate ratios, and is negative for large I/E ratios. Note that LTD leads to an increase in spike output for inputs with large I/E ratios. D, Increasing the amplitude does not lead to a saturation of the probability of rapidly triggered spikes because there is a significant reduction at all stimulation strengths. E, Similarly, the pause duration reflected LTD at all stimulation strength. F, The net spike output increased with LTD at all amplitudes.

Similar articles

Cited by

References

    1. Albus J. A theory of cerebellar function. Math Biosci. 1971;28:167–171.
    1. Armstrong DM, Rawson JA. Activity patterns of cerebellar cortical neurones and climbing fibre afferents in the awake cat. J Physiol (Lond) 1979;289:425–448. - PMC - PubMed
    1. Beierlein M, Regehr WG. Local interneurons regulate synaptic strength by retrograde release of endocannabinoids. J Neurosci. 2006;26:9935–9943. - PMC - PubMed
    1. Bell AJ, Mainen ZF, Sejnowski TJ. “Balancing” of conductances may explain irregularity of cortical spiking. La Jolla, CA: Institute for Neural Computation; 1995. p. 9502.
    1. Bell CC, Grimm RJ. Discharge properties of Purkinje cells recorded on single and double microelectrodes. J Neurophysiol. 1969;32:1044–1055. - PubMed

Publication types

LinkOut - more resources