Comparative Study
. 2007 May 23;27(21):5584-92.
doi: 10.1523/JNEUROSCI.0651-07.2007.

Characterization of ligands for fish taste receptors

Affiliations
Comparative Study

Characterization of ligands for fish taste receptors

Hideaki Oike et al. J Neurosci. .

Abstract

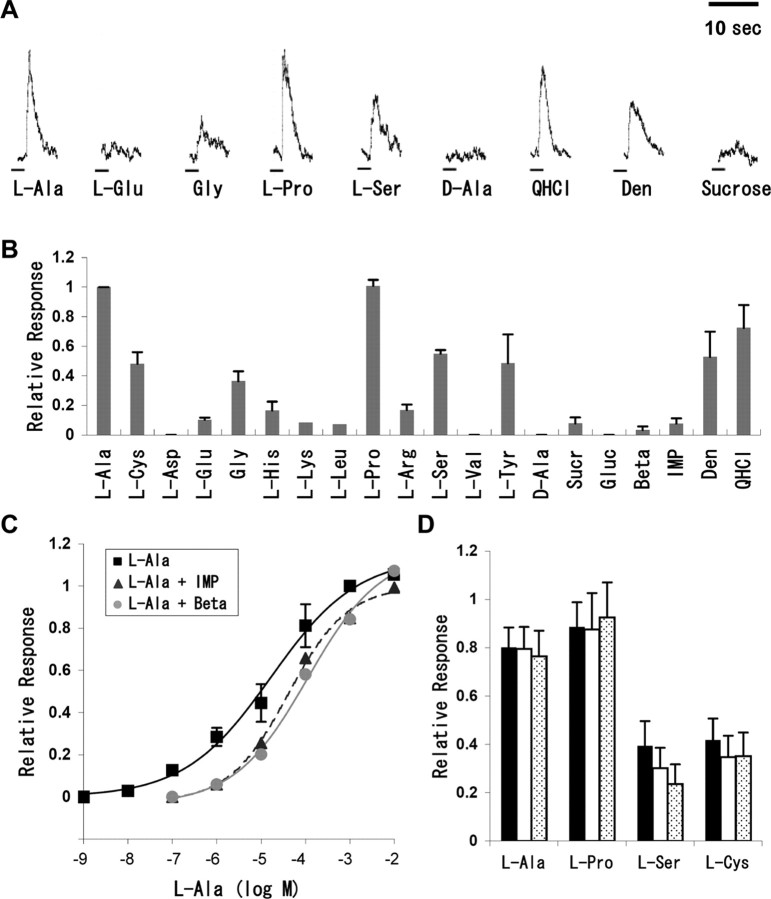
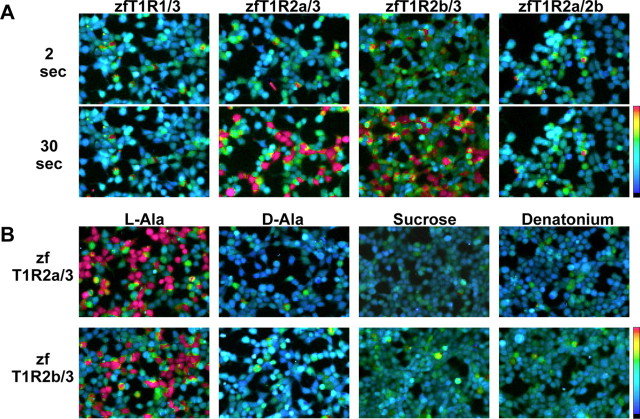
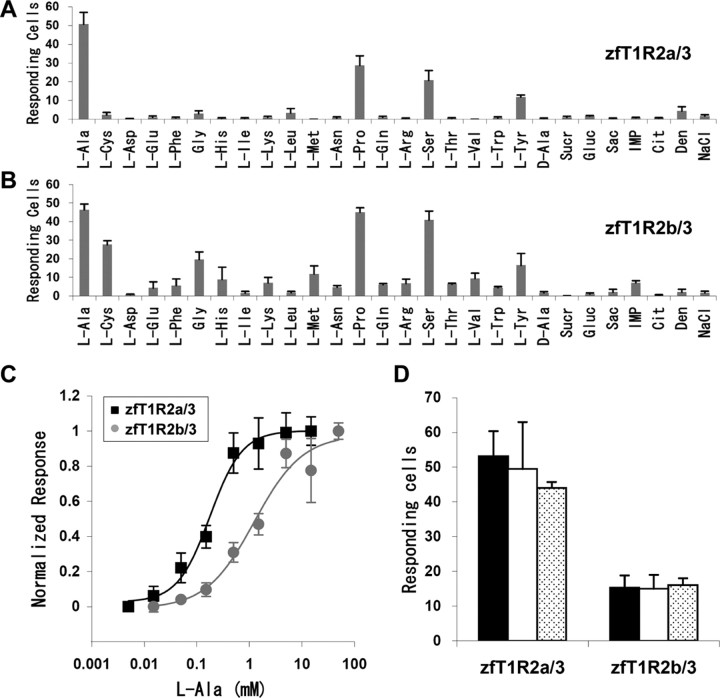
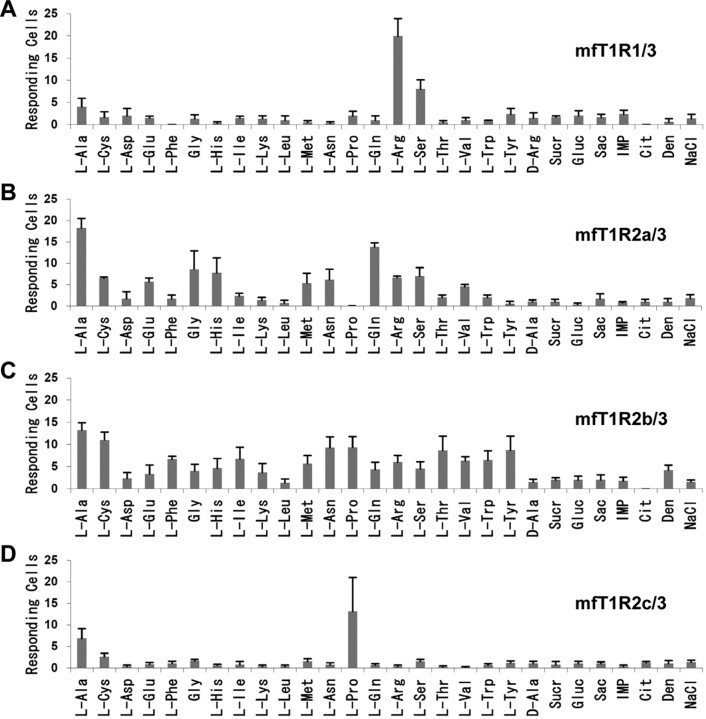
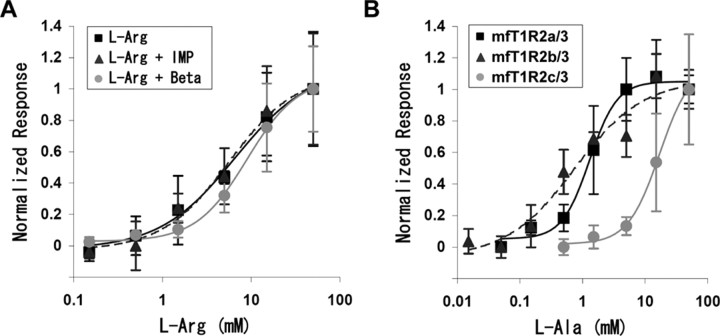
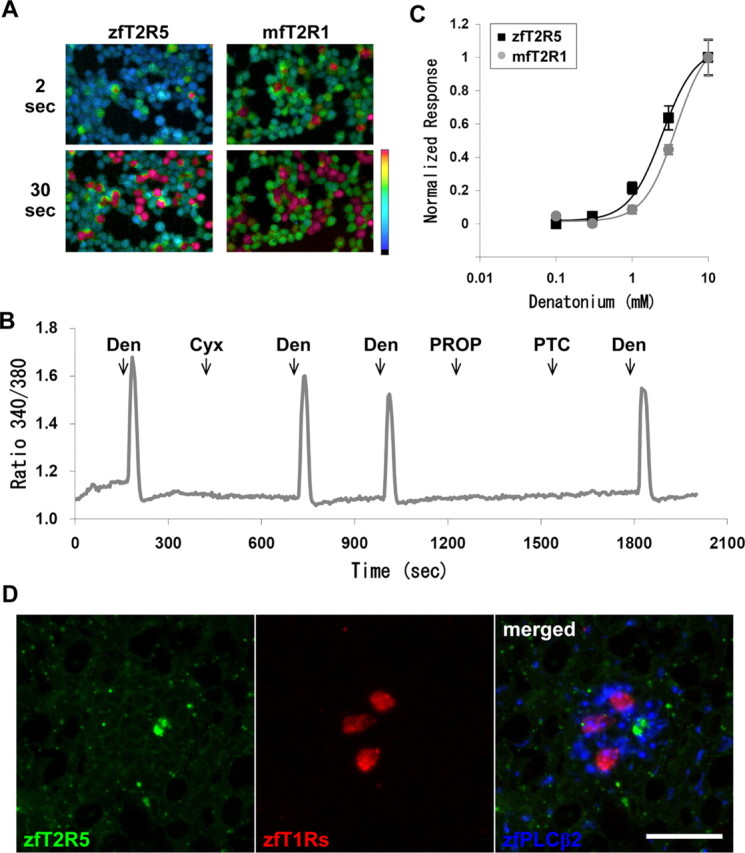
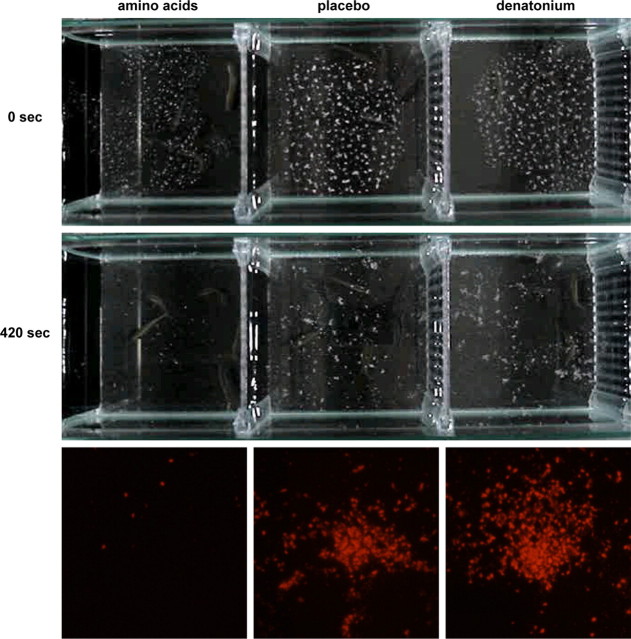
Recent progress in the molecular biology of taste reception has revealed that in mammals, the heteromeric receptors T1R1/3 and T1R2/3 respond to amino acids and sweeteners, respectively, whereas T2Rs are receptors for bitter tastants. Similar taste receptors have also been characterized in fish, but their ligands have not been identified yet. In the present study, we conducted a series of experiments to identify the fish taste receptor ligands. Facial nerve recordings in zebrafish (Danio rerio) demonstrated that the fish perceived amino acids and even denatonium, which is a representative of aversive bitter compounds for mammals and Drosophila. Calcium imaging analysis of T1Rs in zebrafish and medaka fish (Oryzias latipes) using an HEK293T heterologous expression system revealed that both T1R1/3 and a series of T1R2/3 responded to amino acids but not to sugars. A triple-labeling, in situ hybridization analysis demonstrated that cells expressing T1R1/3 and T1R2/3s exist in PLCbeta2-expressing taste bud cells of medaka fish. Functional analysis using T2Rs showed that zfT2R5 and mfT2R1 responded to denatonium. Behavior observations confirmed that zebrafish prefer amino acids and avoid denatonium. These results suggest that, although there may be some fish-specific way of discriminating ligands, vertebrates could have a conserved gustatory mechanism by which T1Rs and T2Rs respond to attractive and aversive tastants, respectively.


Figures

Figure 1.
Figure 1.
Facial nerve responses to various tastants in zebrafish. A, Integrated neural responses to various tastants. The concentrations of ligands used are 1 mm for l-Ala, l-Glu, Gly, l-Pro, l-Ser, d-Ala, and quinine HCl (QHCl), 10 mm for denatonium (Den), and 300 mm for sucrose. Horizontal bars indicate the duration of stimulation by each tastant. B, The neural responses, such as those shown in A, were normalized to the magnitude of responses to the standard, 1 mm l-Ala. Each column represents the mean ± SE of at least three independent assays (l-Lys and l-Leu at n = 2; mean). Sucrose (Sucr) and glucose (Gluc) were used at 300 mm, denatonium at 10 mm, and all other tastants at 1 mm. Beta, Betaine. C, Dose-dependent response of facial nerves to l-Ala in the absence (squares; n = 3) or presence of either 1 mm IMP (triangles with dashed line; n = 2) or 1 mm betaine (gray circles; n = 2). Responses were normalized to the mean response at 1 mm l-Ala. Each point represents the mean ± SE (squares) or the mean (triangles and circles). D, Quantification of the responses to the chemicals. Each amino acid was used at 0.1 mm in the absence (black bars) or presence of either 1 mm IMP (white bars) or 1 mm betaine (hatched bars). Responses were also normalized to the mean response at 1 mm l-Ala.
Figure 2.
Figure 2.
Representative ratiometric images of fura-2-loaded HEK293T cells coexpressing zebrafish T1Rs and G16/gust44 to tastant stimuli. A, Top and bottom show the cell image immediately (2 s) and 30 s after stimulation with 50 mm l-Pro, respectively. The combinations of T1Rs used for the transfection are shown at the top of the panel. B, Ratiometric images of zfT1R2a/3 (top) or zfT1R2b/3 (bottom) transfected cells were obtained 30 s after stimulation with the tastants indicated. Concentrations were 50 mm for l-Ala and d-Ala, 150 mm for sucrose, and 10 mm for denatonium. Color scales indicate the fura-2 340/380 ratio from 0.5 (cyan) to 1.5 (red) as pseudocolor.
Figure 3.
Figure 3.
Responses of HEK293T cells coexpressing zebrafish T1Rs and G16/gust44 to tastant stimuli. A, B, Quantification of responses of zfT1R2a/3- (A) or zfT1R2b/3- (B) transfected cells. Amino acids were used at 50 mm (l-Tyr and l-Trp used at 5 mm), sucrose (Sucr) and glucose (Gluc) at 150 mm, saccharin (Sac), trisodium citrate (Cit), and NaCl concentrations were 50 mm, and IMP and denatonium (Den) were 10 mm. C, Dose-dependent responses of zfT1R2a/3 (squares) and zfT1R2b/3 (gray circles) to l-Ala. Responses were normalized to the mean response at the highest concentrations. D, The response of zfT1R2a/3 and zfT1R2b/3 to 0.5 mm l-Ala in the absence (black bars) or presence of either 1.25 or 10 mm IMP (white bars or hatched bars, respectively). Each column and point in A–D represents the mean ± SE of at least three independent determinations.
Figure 4.
Figure 4.
Responses of HEK293T cells coexpressing medaka fish T1Rs and G16/gust44 to tastant stimuli. A–D, Quantification of responses of mfT1R1/3 (A), mfT1R2a/3 (B), mfT1R2b/3 (C), and mfT1R2c/3 (D). Tastants used were the same as described in Figure 3, A and B, except that d-Arg was used instead of d-Ala for mfT1R1/3. Each column represents the mean ± SE of at least three independent determinations. Sucr, Sucrose; Gluc, glucose; Sac, saccharin; Cit, trisodium citrate; Den, denatonium.
Figure 5.
Figure 5.
Dose-dependent response of medaka fish T1Rs. A, Dose-dependent response of mfT1R1/3 to l-Arg in the absence (squares) or presence of either 1.25 mm IMP (triangles with broken line) or 1.25 mm betaine (Beta; gray circles). B, Dose-dependent response of mfT1R2a/3 (squares), mfT1R2b/3 (triangles with dashed line), and mfT1R2c/3 (gray circles) to l-Ala. Responses in A and B were normalized to the mean response at the highest concentration, and each point represents the mean ± SE of at least three independent assays.
Figure 6.
Figure 6.
A triple-labeling in situ hybridization analysis for T1Rs and PLCβ2 in medaka fish taste buds. A–D, In situ hybridization was performed using horizontal sections of medaka fish gill raker, palate, and pharynx with antisense riboprobes for T1R3, PLCβ2 and T1R1 (A), T1R2a (B), T1R2b (C), or T1R2c (D). Signals are shown in pseudocolor as indicated at the bottom of the panel, and merged images for each result are shown in the right panels. Scale bar, 20 μm.
Figure 7.
Figure 7.
Responses of HEK293T cells coexpressing zfT2R5 or mfT2R1 with G16/gust44 to denatonium, and the expression relationship between zfT2R5 and zfT1Rs in taste buds. A, Representative ratiometric images of fura-2-loaded HEK293T cells during the application of 10 mm denatonium. Top and bottom show the cell images that were obtained 2 and 30 s after stimulation, respectively. Color scale indicates F340/F380 ratio from 0.5 (cyan) to 1.5 (red) as pseudocolor. B, Responses of HEK293T cells coexpressing zfT2R5 and G16/gust44 to various stimuli. Ligands were used at a concentration of 10 mm for denatonium (Den) and 1 mm for cycloheximide (Cyx), 6-n-propylthiouracil (PROP), and phenylthiocarbamide (PTC). All stimuli were perfused for 12 s, and the starting points for each stimulation are indicated by arrows. The trace was derived from 13 responding cells. C, Dose-dependent response of zfT2R5 (squares) and mfT2R1 (gray circles) to denatonium. Responses were normalized to the mean response at the highest concentration. Each point represents the mean ± SE of at least three independent assays. D, A triple-labeling in situ hybridization of T2R5, T1Rs, and PLCβ2 in zebrafish taste buds. In situ hybridization was performed using horizontal sections of zebrafish gill raker, palate, and pharynx with antisense riboprobes for T2R5, T1Rs, and PLCβ2. Signals are shown in pseudocolor as indicated at the bottom of the panel, and a merged image is shown in the right panel. Scale bar, 20 μm.
Figure 8.
Figure 8.
Differences in feeding behaviors. The images were obtained when zebrafish was given the diets containing amino acids (left column), denatonium (right column), and the placebo (middle column), with time course differences in top and bottom. The fluorescence intensities of the uneaten diets remaining in the tank were taken photographically 420 s after the start of ad libitum access to the diets (bottom).

References

    1. Adler E, Hoon MA, Mueller KL, Chandrashekar J, Ryba NJ, Zuker CS. A novel family of mammalian taste receptors. Cell. 2000;100:693–702. - PubMed
    1. Aihara Y, Yasuoka A, Yoshida Y, Ohmoto M, Shimizu-Ibuka A, Misaka T, Furutani-Seiki M, Matsumoto I, Abe K. Transgenic labeling of taste receptor cells in model fish under the control of the 5′-upstream region of medaka phospholipase C-beta 2 gene. Gene Expr Patterns. 2007;7:149–157. - PubMed
    1. Alioto TS, Ngai J. The repertoire of olfactory C family G protein-coupled receptors in zebrafish: candidate chemosensory receptors for amino acids. BMC Genomics. 2006;7:309. - PMC - PubMed
    1. Asano-Miyoshi M, Abe K, Emori Y. IP(3) receptor type 3 and PLCbeta2 are co-expressed with taste receptors T1R and T2R in rat taste bud cells. Chem Senses. 2001;26:259–265. - PubMed
    1. Caprio J. High sensitivity of catfish taste receptors to amino acids. Comp Biochem Physiol A. 1975;52:247–251. - PubMed

Publication types

MeSH terms