Comparative Study
. 2007 May 23;27(21):5621-32.
doi: 10.1523/JNEUROSCI.4630-06.2007.

Multiple modes of synaptic excitation of olfactory bulb granule cells

Affiliations
Comparative Study

Multiple modes of synaptic excitation of olfactory bulb granule cells

Ramani Balu et al. J Neurosci. .

Abstract

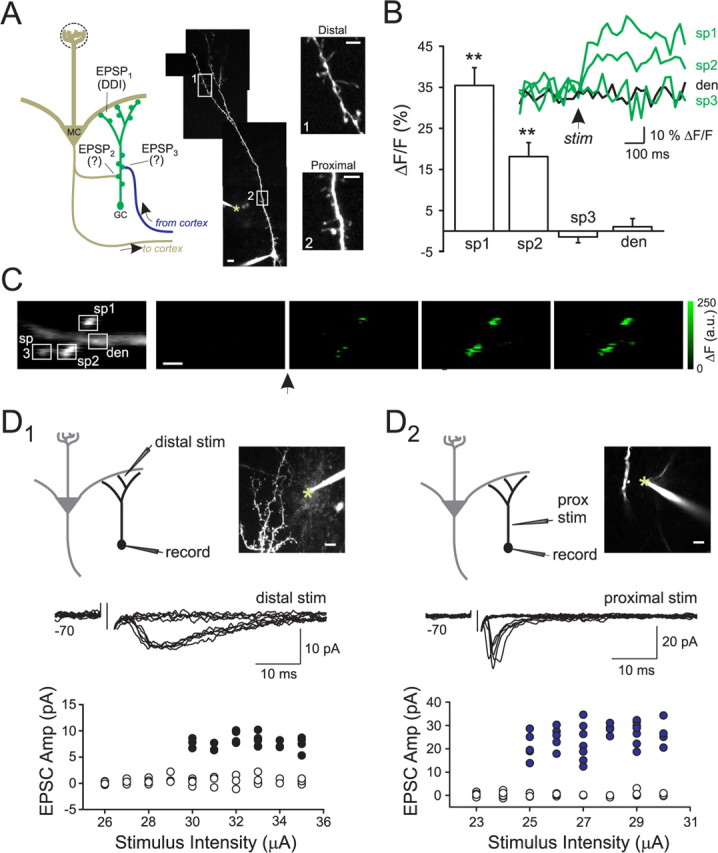
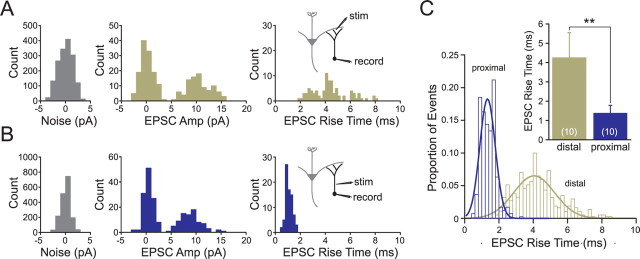
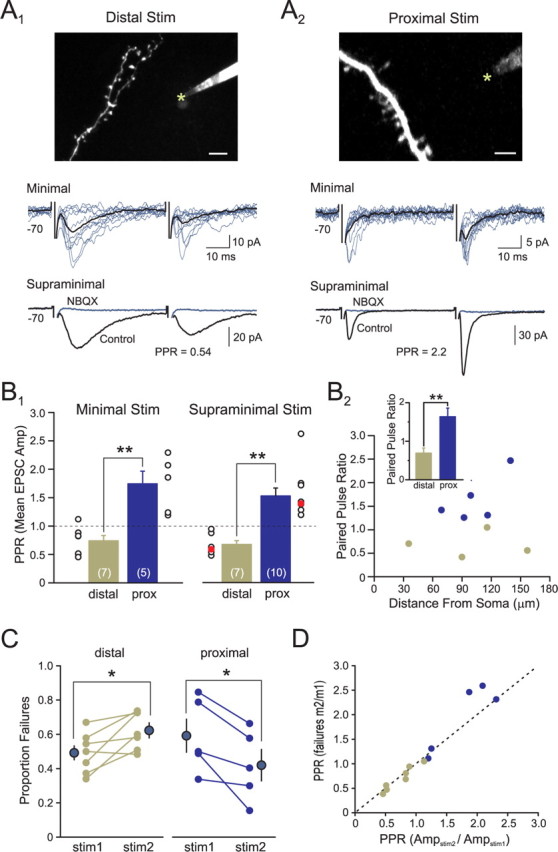
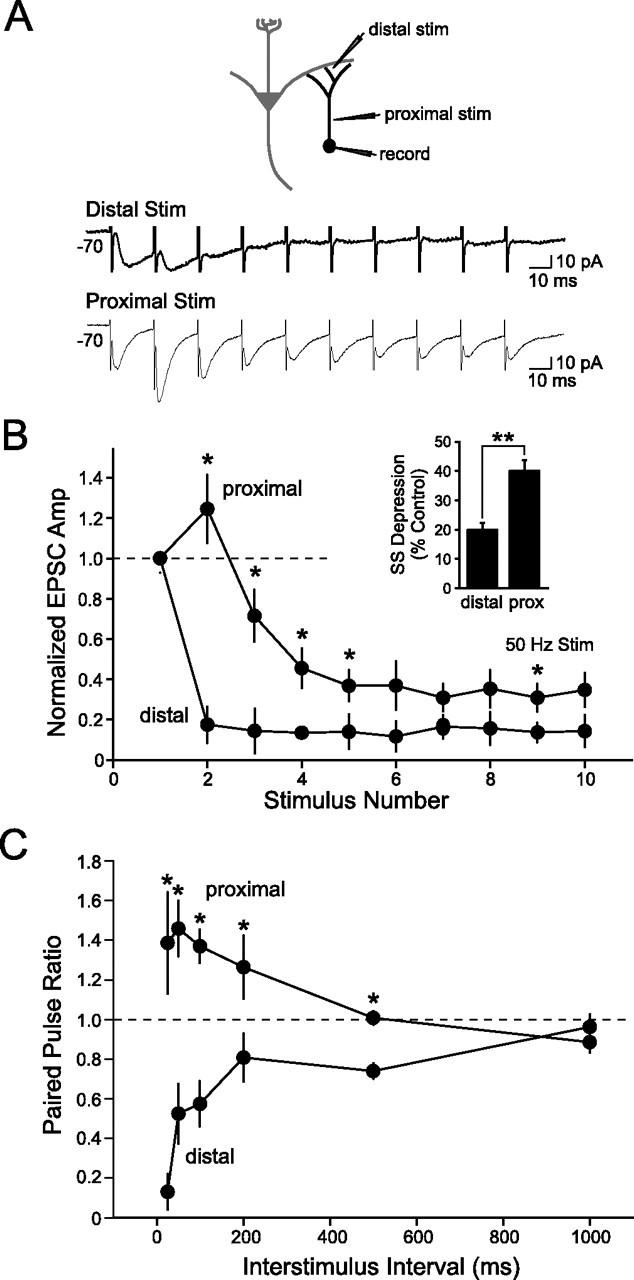
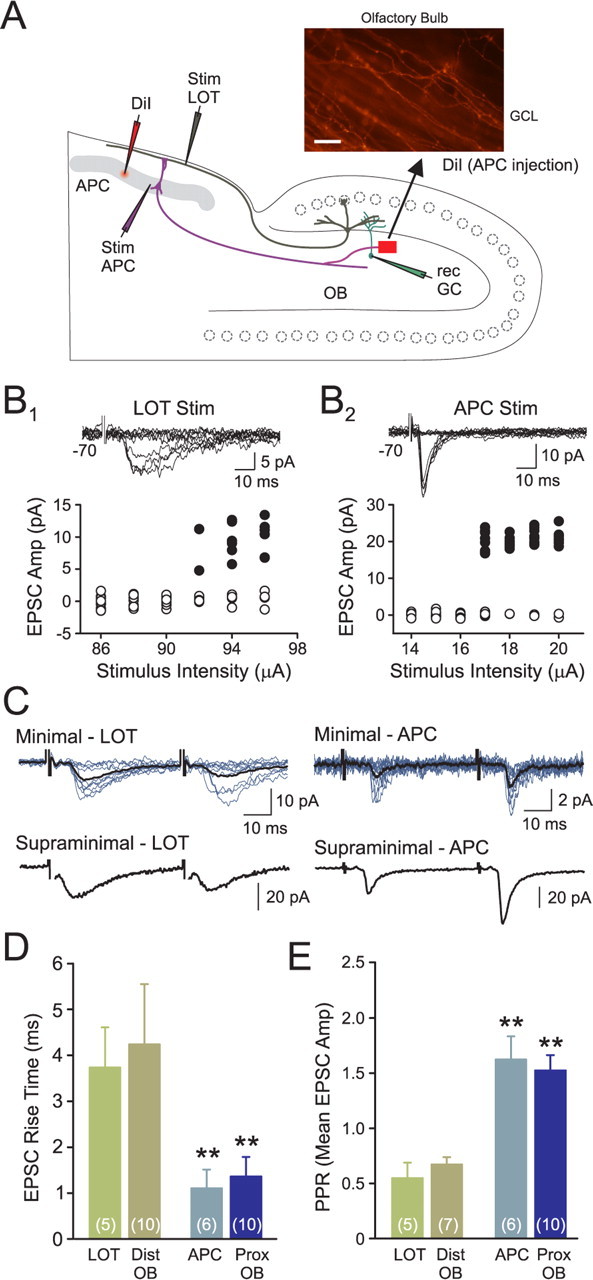
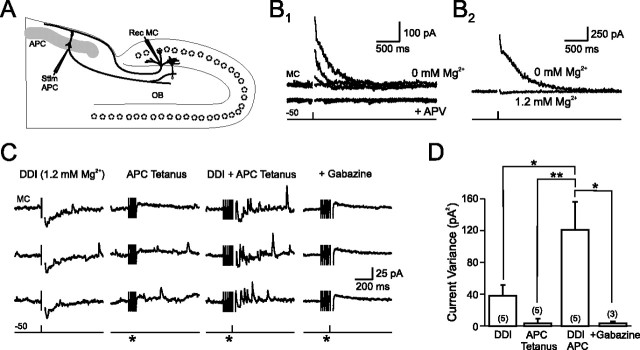
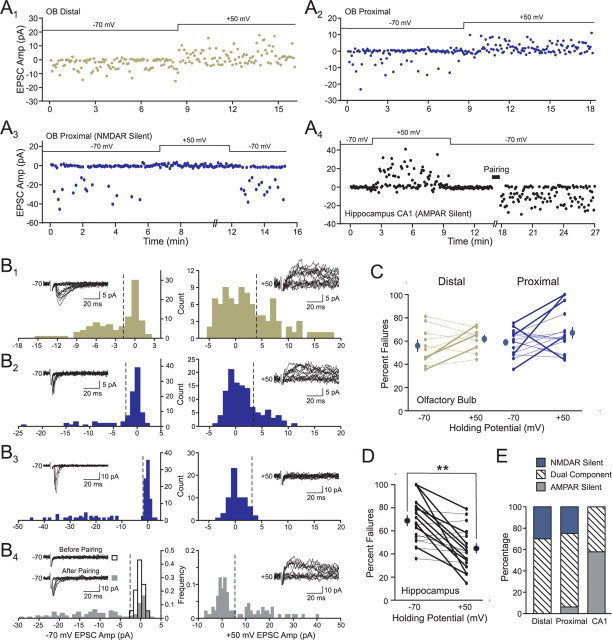
Inhibition generated by granule cells, the most common GABAergic cell type in the olfactory bulb, plays a critical role in shaping the output of the olfactory bulb. However, relatively little is known about the synaptic mechanisms responsible for activating these interneurons in addition to the specialized dendrodendritic synapses located on distal dendrites. Using two-photon guided minimal stimulation in acute rat brain slices, we found that distal and proximal excitatory synapses onto granule cells are functionally distinct. Proximal synapses arise from piriform cortical neurons and facilitate with paired-pulse stimulation, whereas distal dendrodendritic synapses generate EPSCs with slower kinetics that depress with paired stimulation. Proximal cortical feedback inputs can relieve the tonic Mg block of NMDA receptors (NMDARs) at distal synapses and gate dendrodendritic inhibition onto mitral cells. Most excitatory synapses we examined onto granule cells activated both NMDARs and AMPA receptors, whereas a subpopulation appeared to be NMDAR silent. The convergence of two types of excitatory inputs onto GABAergic granule cells provides a novel mechanism for regulating the degree of interglomerular processing of sensory input in the olfactory bulb through piriform cortex/olfactory bulb synaptic interactions.


Figures

Figure 1.
Figure 1.
Two classes of spontaneous EPSCs in granule cells. A, Schematic diagram of excitatory synapses onto granule cells. Two-photon reconstruction of an Alexa 594-filled granule cell shown on the right. A second patch pipette containing Alexa 594 was used for extracellular stimulation and is visible near the apical dendrite. The stimulating electrode tip is indicated by a tan asterisk. Insets show magnified views of granule cell dendrites with spines located on both distal bifurcated dendrites in the EPL (top) and the proximal primary dendrite (bottom). Scale bars: full reconstruction, 10 μm; insets, 5 μm. B, Plot of OGB-1 Ca transients recorded over six trials in the three spines (sp1, sp2, and sp3) and a dendrite shaft segment (den). Focal supraminimal stimuli (single 200 μs shock, 43 μA; Alexa 594-filled stimulating electrode positioned ∼20 μm from imaged dendritic region) reliably triggered Ca accumulations in two of the three imaged spines (sp1 and sp2) but not in the dendritic shaft segment. Statistically significant increases over baseline are indicated by asterisks (**p < 0.01). Inset, Example ΔF/F traces from one trial. C, Two-photon images of baseline OGB-1 fluorescence (left) and ΔF image frames before and immediately after a single focal stimulus. Stimulus-evoked Ca accumulations were restricted to a subset of imaged dendritic spines. Labeled regions of interest correspond to image areas analyzed in B. Acquired images were 392 by 64 pixels; 25 ms/frame. Scale bar, 3 μm. D, Plots of amplitudes of unitary EPSCs evoked by two-photon guided minimal stimulation (stim) of distal (D1) and proximal (prox) (D2) granule cell dendrites versus stimulus intensity. Insets show two-photon images of the relationship between the distal stimulating electrode in the EPL and the proximal stimulating in the GCL and the recorded granule cells. Both recording and stimulating pipettes were filled with Alexa 594. The stimulating electrode tip is indicated by a tan asterisk. Scale bar: Left, 10 μm; right, 7 μm. Distal minimal stimulation evoked all-or-none EPSCs with slow-rising phases, whereas proximal minimal stimulation evoked fast-rising EPSCs. Both distal and proximal stimulation responses show sharp activation thresholds with distinguishable successes (filled circles) and failures (open circles). Example threshold responses are shown above each plot.
Figure 2.
Figure 2.
Kinetic differences between distal and proximal minimal EPSCs. A, B, Amplitude (middle) and rise time (right) EPSC distributions calculated from distal (A, gold) and proximal (B, purple) two-photon guided minimal stimulation. Inset shows relative position of the stimulating electrode (stim). Data from two different granule cells held at −70 mV. Distribution of failures in the amplitude plots closely matches the noise amplitude distribution calculated from the same cells (left). Note the different EPSC rise time distributions between responses evoked from the two stimulus positions. C, Summary plot of the rise time distribution from all distal (n = 10 cells; gold) and proximal (n = 10 cells; purple) stimulation experiments. Both distributions were well fit by Gaussian distributions (smooth curves). The inset shows statistically significant difference in mean EPSC rise time for the two stimulation sites (**p < 0.01).
Figure 3.
Figure 3.
Distal and proximal excitatory synapses have different forms of short-term plasticity. A, Granule cell responses to two-photon guided paired-pulse stimulation (stim) (50 ms ISI) of either distal (A1) or proximal (A2) dendrites. Minimal responses to distal stimulation (top traces) show paired-pulse depression, whereas analogous responses to proximal stimulation show paired-pulse facilitation. Increasing the stimulus intensity to recruit additional axons (bottom traces) did not change the type of paired-pulse modulation at either synapse. Both distal and proximal EPCSs were blocked by the non-NMDA glutamate receptor antagonist NBQX (10 μm; gray traces). Images above traces show relationship between Alexa 594-filled stimulating pipette and the recorded neuron. Scale bars: A1, 10 μm; A2, 5 μm. The stimulating electrode tip is indicated by a tan asterisk. B1, Summary graphs showing PPR calculated by mean EPSC amplitudes for 12 minimal stimulation experiments (left) and 17 supraminimal stimulation experiments (right). Paired-pulse ratios were significantly different between proximal and distal stimulus sites at both stimulus intensity ranges (**p < 0.01). Paired-pulse ratios for individual experiments are shown by open circles. Red filled circles in the supraminimal graph represent results from a single granule cell that was stimulated at both proximal and distal dendritic sites. B2, Plot of the paired-pulse ratio versus distance between the cell body and the stimulating electrode. The inset shows significant difference (p < 0.01) in PPRs between proximal and distal distance-controlled 2PGMS experiments. C, Paired-pulse depression at distal synapses was associated with a statistically significant increase in failure rate (left) at minimal stimulus intensities, whereas paired-pulse facilitation at proximal synapses resulted in a decrease in failure rate (right; *p < 0.05.) D, Plot of PPR calculated by mean EPSC amplitude versus the PPR calculated as the ratio of quantal contents (m) obtained by analyzing failure rates. Both proximal (purple dots) and distal minimal stimulation results (gold dots) fall near the dashed line representing equal PPR ratios.
Figure 4.
Figure 4.
Frequency-dependent modulation at distal and proximal excitatory synapses. A, Granule cell responses to a 50 Hz supraminimal distal (top) and proximal (bottom) stimulus train. Note the rapid silencing of the distal response by the fourth stimulus. Proximal synapses initially facilitate then show steady-state depression. B, Summary of eight experiments using two-photon guided 50 Hz stimulus trains (4 proximal and 4 distal) (*p < 0.05). The inset shows mean steady-state depression in the last three responses of the train for proximal and distal stimulation normalized to the initial response amplitude (**p < 0.01). C, Plot of the paired-pulse ratio, calculated from the mean supraminimal response amplitude, versus interstimulus interval for four proximal two-photon guided stimulation (stim) experiments and four distal experiments (*p < 0.05).
Figure 5.
Figure 5.
Cortical feedback projections generate facilitating, fast-rising EPSCs in granule cells. A, Diagram of the combined olfactory bulb-anterior piriform cortex slice preparation. Mitral cell axon collaterals and cortical feedback projections were independently activated by stimulating the LOT or the deep pyramidal cell layer of the APC, respectively. Focal DiI injections in the APC confirmed that the combined OB-APC brain slice contained cortical axons that innervated the olfactory bulb. The inset shows DiI-labeled axons with en passant boutons in the GCL. B, Granule cell responses to minimal LOT stimulation (stim) in the APC (B1) and focal APC stimulation (B2). Antidromic mitral cell activation (LOT stimulation) evoked slow-rising EPSCs that resembled the distal responses shown in Figure 1D, whereas APC stimulation evoked fast-rising EPSCs that resembled proximal responses. C, Both minimal and supraminimal LOT stimulation evoked EPSCs that depressed (left), whereas EPSCs evoked by APC stimulation facilitated (right). D, Summary plot of mean EPSC rise time for minimal LOT (n = 5) and APC (n = 6) stimulation experiments. Corresponding results from two-photon guided focal stimulation of distal (gold shading) and proximal (purple shading) also are replotted from Figure 2C. APC-evoked EPSCs had significantly faster rise times than both LOT- and distal OB-evoked minimal EPSCs (**p < 0.01; one-way ANOVA). E, Summary graph of paired-pulse ratio, calculated from mean EPSC amplitude, for five LOT and six APC stimulation experiments. Corresponding results from distal and proximal OB stimulation are replotted from Figure 3B1 for comparison. The PPR of APC-evoked EPSCs was significantly greater than either LOT- or distal OB-evoked EPSCs (**p < 0.01; one-way ANOVA).
Figure 6.
Figure 6.
Cortical synaptic input gates dendrodendritic inhibition onto mitral cells. A, Diagram of experiment. B1, Dendrodendritic inhibitory responses in mitral cells to steps to +20 mV for 1, 2, 3, and 5 ms duration in Mg-free ACSF (0 mm Mg). Dendrodendritic responses were blocked by 50 μm d-APV. B2, Dendrodendritic inhibition evoked by a step to +20 mV was blocked by 1.2 mm Mg. C, Near coincident mitral cell (MC) depolarization and APC stimulation (stim) evokes dendrodendritic inhibition in mitral cells. Example responses to voltage-clamp depolarization alone (DDI, to +20 mV, 2 ms duration; left), APC stimulation alone (APC Tetanus; 5 × 50 Hz; middle traces), and both intracellular depolarization and APC stimulation (DDI + APC; right traces). The last set of traces shows the effect of the GABAA receptor antagonist gabazine (10 μm) on the DDI + APC responses. The combination of intracellular depolarization and APC stimulation evoked trains of GABAA receptor-mediated outward currents. D, Summary graph of the results from five experiments using the protocol shown in C. Dendrodendritic inhibition, as assayed by current variance, was significantly increased after depolarization plus APC stimulation, compared with either stimulation method alone. The GABAA receptor antagonist gabazine (10 μm) blocked the dendrodendritic inhibition associated variance increase (*p < 0.05; **p < 0.01). All experiments in C and D were conducted with normal ACSF (containing 1.2 mm Mg).
Figure 7.
Figure 7.
Tests for AMPAR and NMDAR silent excitatory synapses on granule cells. A, Plots of response amplitude to two-photon guided minimal stimulation at 0.2 Hz in the EPL (A1), the GCL (A2A3), and stratum radiatum stimulation of a hippocampal CA1 pyramidal cell (A4). Membrane potentials are indicated above each plot. Experiments in A1 and A2 illustrate examples of dual (NMDA and non-NMDA receptor) component minimal stimulation responses. A3 illustrates an example of NMDA receptor silent granule cell response. A4 illustrates an example of an AMPA receptor silent response in a CA1 pyramidal cell that was converted into a dual component response by pairing 50 minimal stimuli with intracellular depolarization to 0 mV. B, Amplitude histograms generated from the responses plotted in A. Separate histograms are shown for responses at −70 and +50 mV; B4 shows the change in the −70 mV response amplitude distribution before (open bars) and after (shaded bars) pairing. The vertical dashed line represents 2 × SD of the noise distribution. Example traces are shown above each plot. C, D, Summary plots of the results from experiments using proximal (C, right; n = 16 cells) and distal (C, left; n = 10 cells) two-photon guided minimal stimulation of granule cells and stratum radiatum stimulation of CA1 pyramidal cells (D; n = 19 cells). Each summary plot shows the response failure rate at −70 and +50 mV (inside dots connected by lines) and the overall failure rate for the each group of experiments at −70 and +50 mV (outside dots with error bars). Only the group of experiments using CA1 pyramidal cells showed a statistically significant difference in mean failure rate at −70 and +50 mV (**p < 0.01; paired t test). Analysis of the failure rate in each individual experiment showed statistically significant differences between −70 and +50 mV in 5 of 16 proximal and 3 of 10 distal granule cell minimal stimulation experiments and 11 of 19 CA1 pyramidal minimal stimulation experiments (thick lines; χ2 test; p < 0.01; three experiments with 100% failures at −70 mV included in significant difference category). E, Summary plot showing the proportion of experiments classified as NMDAR silent (blue; statistically higher failure rate at +50 than −70 mV; p < 0.01), AMPAR silent (gray; statistically greater failure rate at −70 than +50 mV; p < 0.01), and dual component (hashed; no statistically significant difference in failure rates at −70 and +50 mV; p > 0.01) for the three stimulation sites.

References

    1. Alvarez-Buylla A, Garcia-Verdugo JM. Neurogenesis in adult subventricular zone. J Neurosci. 2002;22:629–634. - PMC - PubMed
    1. Bredt DS, Nicoll RA. AMPA receptor trafficking at excitatory synapses. Neuron. 2003;40:361–379. - PubMed
    1. Cang J, Isaacson JS. In vivo whole-cell recording of odor-evoked synaptic transmission in the rat olfactory bulb. J Neurosci. 2003;23:4108–4116. - PMC - PubMed
    1. Carleton A, Petreanu LT, Lansford R, Alvarez-Buylla A, Lledo PM. Becoming a new neuron in the adult olfactory bulb. Nat Neurosci. 2003;6:507–518. - PubMed
    1. Chen WR, Xiong W, Shepherd GM. Analysis of relations between NMDA receptors and GABA release at olfactory bulb reciprocal synapses. Neuron. 2000;25:625–633. - PubMed

Publication types

LinkOut - more resources