. 2007 Aug;18(8):3059-67.
doi: 10.1091/mbc.e06-08-0689. Epub 2007 May 23.

Replication fork velocities at adjacent replication origins are coordinately modified during DNA replication in human cells

Affiliations

Replication fork velocities at adjacent replication origins are coordinately modified during DNA replication in human cells

Chiara Conti et al. Mol Biol Cell. 2007 Aug.

Abstract

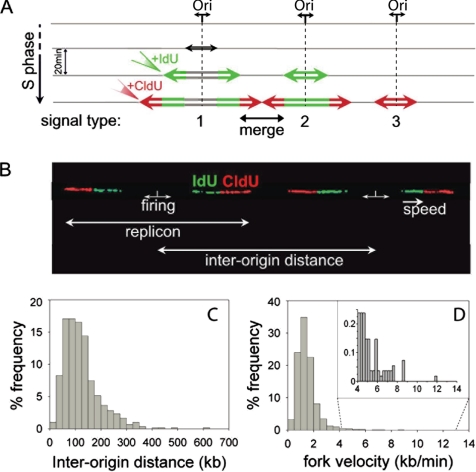
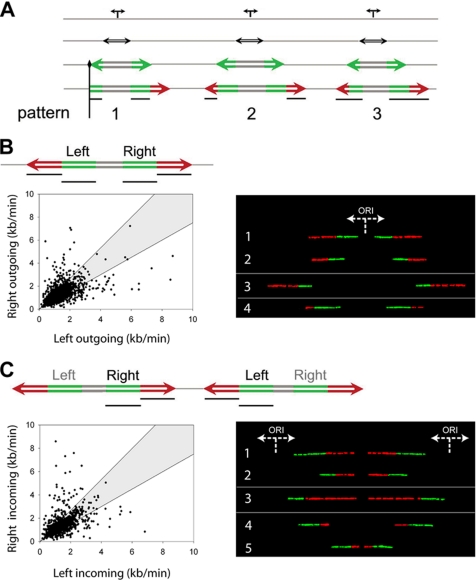
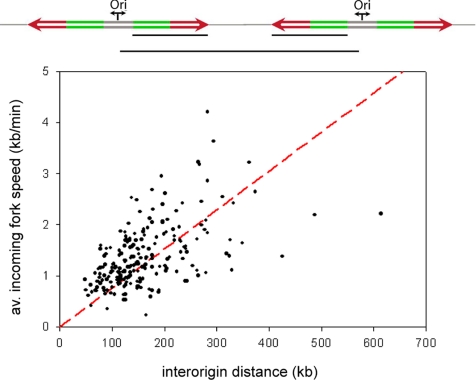
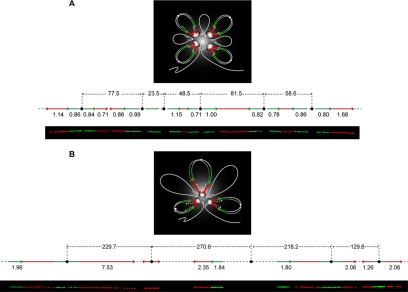
The spatial organization of replicons into clusters is believed to be of critical importance for genome duplication in higher eukaryotes, but its functional organization still remains to be fully clarified. The coordinated activation of origins is insufficient on its own to account for a timely completion of genome duplication when interorigin distances vary significantly and fork velocities are constant. Mechanisms coordinating origin distribution with fork progression are still poorly elucidated, because of technical difficulties of visualizing the process. Taking advantage of a single molecule approach, we delineated and compared the DNA replication kinetics at the genome level in human normal primary and malignant cells. Our results show that replication forks moving from one origin, as well as from neighboring origins, tend to exhibit the same velocity, although the plasticity of the replication program allows for their adaptation to variable interorigin distances. We also found that forks that emanated from closely spaced origins tended to move slower than those associated with long replicons. Taken together, our results indicate a functional role for origin clustering in the dynamic regulation of genome duplication.


Figures

Figure 1.
Figure 1.
Interorigin distances and total fork velocities. (A) Schematic representation of signals deriving from equal pulse-labeling with iodo-deoxyuridine (IdU) and chloro-deoxyuridine (CldU). Replication forks progress bidirectionally at the same rate from the origin and incorporate the analogues forming a symmetrical replication bubble. On detection of IdU and CldU, three types of signals may be obtained: a green and red signal with a gap between the green segments, corresponding to initiations that occurred before the beginning of the pulse (1); a dual-color signal with a continuous green segment corresponding to origins that fired during the first pulse (2); and a single isolated red signal corresponding to origins that fired during the second pulse (3). A continuous red signal flanked by two green ones is formed by the merging of two forks from adjacent origins. (B) Two adjacent replication bubbles are visualized on a combed DNA molecule (type 1 signal). The replication origins are assumed to be located in the midpoints of the unlabeled segments (see text). The distance between adjacent replication origins represents the interorigin distance. Fork speed is calculated by dividing the length of each fluorescent signal by the time of the pulse. (C) Histogram of the interorigin distances (median = 111; N = 606). (D) Histogram of the total fork velocities (mean = 1.46; N = 5460) for the human primary normal keratinocytes. In the panel, an enlarged view of the higher fork velocities (4–12 kb/min) is shown.
Figure 2.
Figure 2.
Correlated changes in fork velocities. (A) Schematic representation of asymmetric replication bubbles resulting either from blocked forks (type 1 signal) or from changes in fork velocity (type 2 and 3 signals). Vertical black line, a permanent replication fork barrier; horizontal black lines, the segments that were measured and compared in order to examine fork speed correlations. (B) Coregulation of forks moving from a single origin (outgoing forks). Left, a scheme of the signals used in the analysis is represented at the top, with black lines indicating the segments that were measured and plotted against each other. In the scatter diagram, each dot corresponds to the ratio between the right and the left fork velocities of a pair of outgoing forks belonging to the same replication bubble. The shaded area includes all points whose ratios deviate from the expected theoretical value of 1 for <33%. The significant positive correlation of the outgoing forks (R = 0.53; p < 0.001; N = 1518) and the value of their linear regression coefficient (b = 0.87) indicate that they move bidirectionally at nearly the same rate. Right, examples of correlations between corresponding outgoing forks on individual DNA molecules. Generally, forks tend to maintain a constant speed between the first (green) and the second (red) pulse (see molecules 1 and 2). However, when this condition is not satisfied (see molecules 3 and 4), the symmetry between corresponding outgoing forks is still maintained, indicating a simultaneous change of their velocities. (C) Coregulation of forks moving from adjacent origins (incoming forks). Left, as in B, a scheme of the signals used for the analysis is shown at the top of the diagram. The black lines indicate the pair of segments measured and plotted against each other and are represented in the scatter graph with the same delimiting envelope. The significant positive correlation of the incoming forks (R = 0.50; p < 0.001; N = 1172) and the value of their linear regression coefficient (b = 0.93) indicate that they move at nearly the same rate. Right, examples of correlations between corresponding incoming forks on individual DNA molecules. As in B, right panel, forks tend to keep a constant speed between the first and the second pulse (see molecules 1 and 2). However, when this condition is not fulfilled (see molecules 3–5), the symmetry between corresponding incoming forks is still maintained, indicating a simultaneous change of their velocities.
Figure 3.
Figure 3.
Positive linear correlation between interorigin distance and average incoming fork velocity. At the top is a scheme of two replication eyes and, as indicated by the black lines, the parameters that were measured and plotted against each other, which is the distance between two adjacent origins and the average value of their corresponding incoming fork speeds. The graph shows a positive linear correlation between the two parameters (R = 0.54; p < = 0.001; N = 219), indicating that the average value of the incoming fork speeds increases linearly with the interorigin distance. In red the regression line is represented. This homeostatic mechanism of coregulation between replication fork progression and origin spacing ensures the complete duplication of the genome while keeping pace with the cell cycle.
Figure 4.
Figure 4.
Model for DNA replication within a replicon cluster. In the figure, the diffuse gray color indicates the mass of the focus, where the replisomes are represented by white ovals. At the top of the loops, the small circles indicate the origins. During DNA replication in S-phase, replicons remain associated with the replisome forming the foci. Newly synthesized DNA (daughter duplexes labeled in green and red) is extruded in loops while the parental duplex (single white line) slides through the fixed sites. During this process, parental loops shrink and daughter loops grow (as indicated by the white arrows). The green and red segments refer to the first and second pulse labels, respectively, with the arrows indicating the direction of their progression. Stripping the looped DNA from the factory and spreading it as a linear fiber, produces a pattern as the one visualized by molecular combing and schematically represented on the bottom of each model. (A) For relatively shortly and regularly spaced origins, the correlations between the replication forks emanating from a same origin (outgoing forks) or from contiguous origins (incoming forks) are generally maintained. A representative molecule is shown in the picture and schematically depicted above with the corresponding values of fork velocities (kb/min) and interorigin distances (kb). (B) In the case of largely and irregularly spaced origins, instead, the symmetry between outgoing forks is preferentially maintained over that of the incoming forks, suggesting a higher control of the replication program at the level of the single replicons. However, the plasticity of the replication program allows for compensation of wide replicon sizes with increasing average incoming fork speed, thus ensuring the timely completion of genome duplication. A representative example is shown in the picture together with its schematic depiction.

Similar articles

Cited by

References

    1. Aladjem M. I., Fanning E. The replicon revisited: an old model learns new tricks in metazoan chromosomes. EMBO Rep. 2004;5:686–691. - PMC - PubMed
    1. Bensimon A., Simon A., Chiffaudel A., Croquette V., Heslot F., Bensimon D. Alignment and sensitive detection of DNA by a moving interface. Science. 1994;265:2096–2098. - PubMed
    1. Berezney R., Dubey D. D., Huberman J. A. Heterogeneity of eukaryotic replicons, replicon clusters, and replication foci. Chromosoma. 2000;108:471–484. - PubMed
    1. Berezney R., Mortillaro M. J., Ma H., Wei X., Samarabandu J. The nuclear matrix: a structural milieu for genomic function. Int. Rev. Cytol. 1995;162A:1–65. - PubMed
    1. Blow J. J., Gillespie P. J., Francis D., Jackson D. A. Replication origins in Xenopus Egg extract are 5–15 kilobases apart and are activated in clusters that fire at different times. J. Cell Biol. 2001;152:15–25. - PMC - PubMed

Publication types

LinkOut - more resources