. 2007 Aug 1;582(Pt 3):1163-78.
doi: 10.1113/jphysiol.2007.134460. Epub 2007 May 24.

The main source of ambient GABA responsible for tonic inhibition in the mouse hippocampus

Affiliations

The main source of ambient GABA responsible for tonic inhibition in the mouse hippocampus

Joseph Glykys et al. J Physiol. .

Abstract

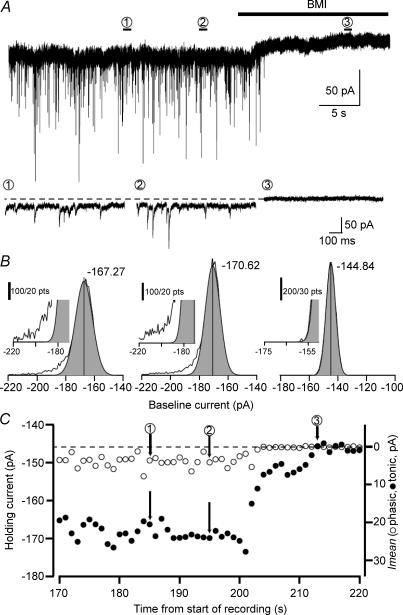
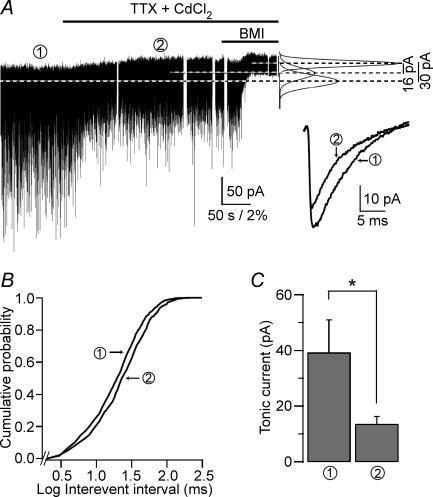
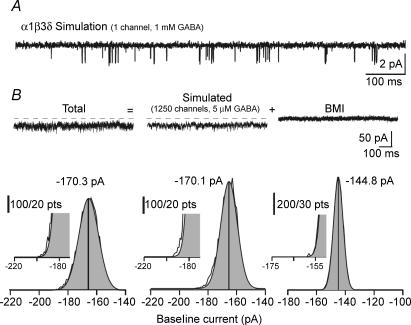
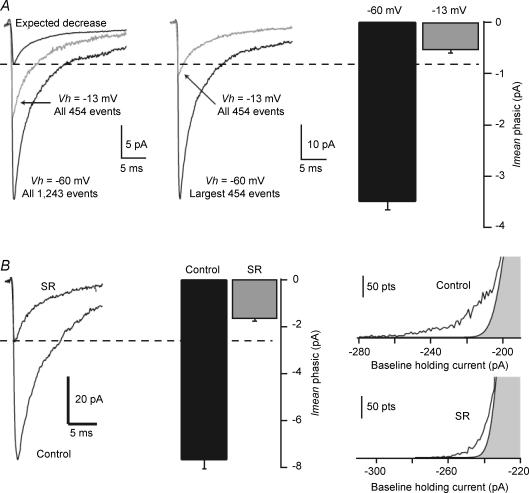
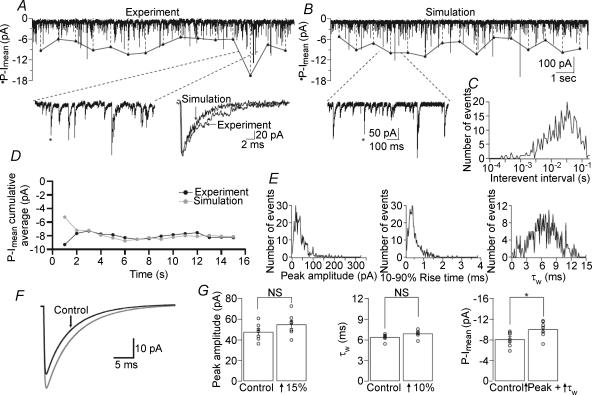
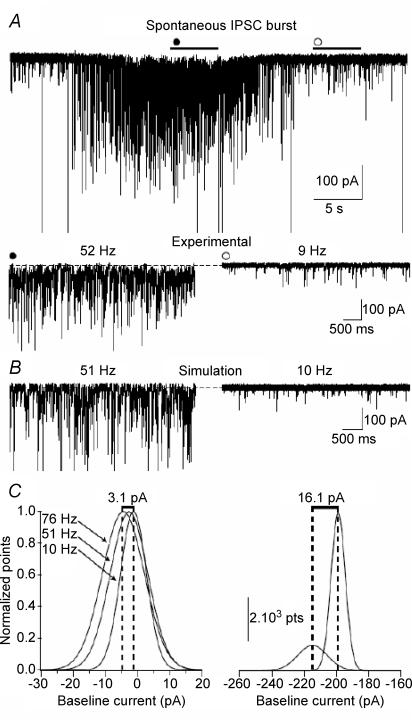
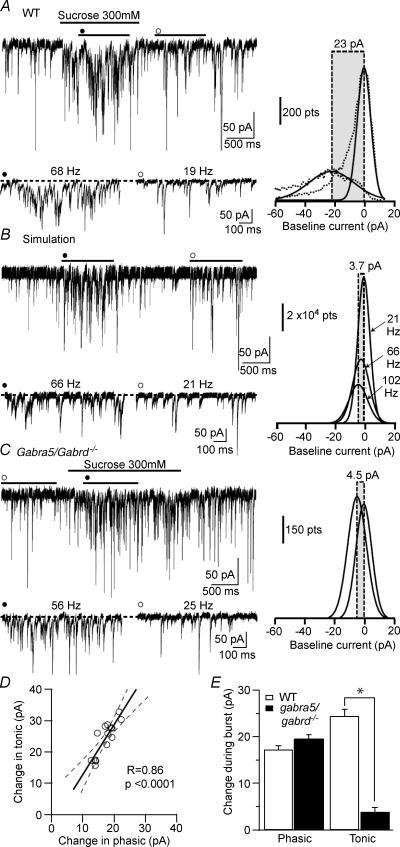
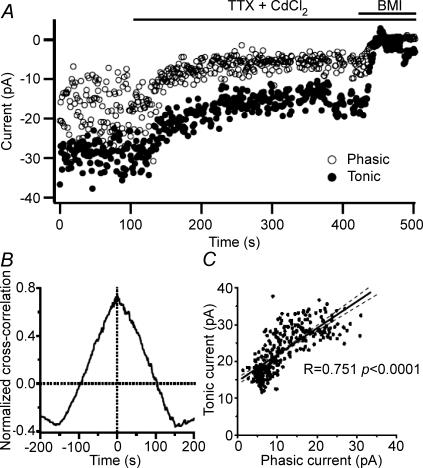
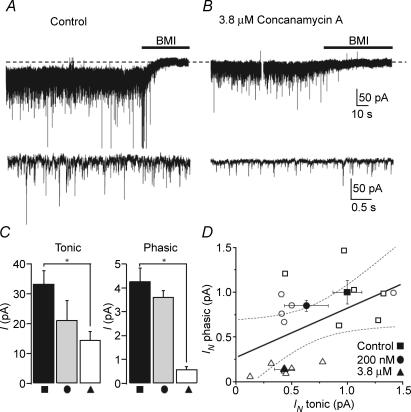
The extracellular space of the brain contains gamma-aminobutyric acid (GABA) that activates extrasynaptic GABA(A) receptors mediating tonic inhibition. The source of this GABA is uncertain: it could be overspill of vesicular release, non-vesicular leakage, reverse transport, dying cells or glia. Using a novel approach, we simultaneously measured phasic and tonic inhibitory currents and assessed their correlation. Enhancing or diminishing vesicular GABA release in hippocampal neurons caused highly correlated changes in the two inhibitions. During high-frequency phasic inhibitory bursts, tonic current was also enhanced as shown by simulating the summation of IPSCs and by recordings in knockout mice devoid of tonic inhibitory current. When vesicular release was reduced by blocking action potentials or the vesicular GABA transporter, phasic and tonic currents decreased in a correlated fashion. Our results are consistent with most of hippocampal tonic inhibitory current being mediated by GABA released from the very vesicles responsible for activating phasic inhibition.


Figures

Figure 2
Figure 2. Simultaneous measurement of phasic and tonic currents using the Imean method
A, whole-cell voltage-clamp recording from a CA1 PC (Vh=−70 mV) in the presence of 3 mm kynurenic acid and 5 μm GABA with three numbered periods of 1 s each consisting of 10 000 points (1 and 2 are control periods, 3 in the presence of 100 μm BMI). Lower panels are showing, on an expanded time scale, the periods used to calculate tonic and phasic currents in B. B, Gaussian fits to the all-points histograms of the indicated periods. The peak of the Gaussian denotes the mean tonic current while all the points outside of the Gaussian distribution (skewed to the left) constitute the phasic current (see Methods for details). Insets: higher magnifications of the corresponding graphs. C, phasic (○) and tonic (•) current measurements (performed every second) showing their variability over time. Holding current is indicated on the left axis, the right axis shows the measured Imean. Note the larger tonic Imean compared with the phasic Imean throughout the recording. Numbers indicate the corresponding time periods in A and B.
Figure 1
Figure 1. Concomitant reduction in phasic and tonic inhibitions after blocking action potential-dependent vesicular release
A, whole-cell voltage-clamp recording from a CA1 PC (Vh=−70 mV) in the presence of 3 mm kynurenic acid and 7.5 μm NO-711. Horizontal lines over the recording denote the time of drug perfusions. Right panel: Gaussian fits to all-points histograms derived from the numbered 30 s recording periods (1, control; 2, 0.5 μm TTX + 50 μm CdCl2) and a 15 s recording period during the perfusion of BMI used to determine the tonic current. The differences between the Gaussian means marked by the dotted lines are indicated. Inset: average sIPSC from the numbered time periods of the recording (1, 1130 events; 2, 919 events). B, cumulative probability of the log scaled interevent intervals recorded during the two numbered time periods (same number of events as used in the inset of A). C, the average tonic current is significantly reduced by blocking action potentials and Ca2+ entry into the terminals (39.1 ± 11.8 pA versus 13.5 ± 2.8 pA, n = 6 cells). *P = 0.031 Wilcoxon matched-pairs signed-ranks test).
Figure 3
Figure 3. Tonic current without phasic current follows a Gaussian distribution in the Imean method
A, simulation of single channel openings of an α1β3δ GABAA channel activated by 1 mm GABA based on the kinetic model of Haas & MacDonald (1999) (compare this simulated trace with the experimental trace shown in Fig. 5A of that publication). B, upper panels: simulated current generated by the activation of 1250 α1β3δ GABAA channels by 5 μm GABA (Vh=−70 mV, EGABA= 0 mV) using the kinetic model as in A. The current trace recorded in the presence of BMI is the same as that shown in Fig. 2B. Total current was determined as the sum of the simulated current and the current recorded during BMI. Lower panels: Gaussian fits to right sides of the all-points histograms of the indicated traces. The peak of the Gaussian denotes the mean holding current. Note on the insets the lack of deviation from the Gaussian distribution (i.e. the absence of a skew) compared with when phasic currents are present (insets on Fig. 2B).
Figure 4
Figure 4. Accuracy of the Imean method for detecting changes in the phasic current
CA1 PC recorded in the presence of 3 mm kynurenic acid and 5 μm GABA at two separate holding potentials of −60 and −13 mV. A, left panel: average sIPSC (of the indicated number of events) recorded at the two potentials. The change in driving force is expected to reduce the average IPSCs at −13 mV by 78% compared with that recorded at −60 mV. Middle panel: count-matching the number of events recorded at −13 mV with the largest amplitude sIPSCs recorded at −60 mV gives a more accurate value of 72% reduction. Right panel: using the Imean method gives a similar decrease (84%). B, left panel: average sIPSC recorded under control conditions in a CA1 PC and in another cell in the presence of 200 nm gabazine (SR; averages of the largest 100 events). Middle panel: the phasic current calculated by the Imean method shows a similar reduction without the need for event detection and count-matching. Right panel: sample all-point histograms measured over 1 s epochs recorded in two different cells in different conditions. Note the decrease in the skewed part of the histogram corresponding to the phasic current when the cell is exposed to gabazine (SR). In A and B, the Imean was obtained as the average of 60 or 30 1-s segments, respectively.
Figure 5
Figure 5. Comparison of experimental and simulated events
A, whole-cell voltage-clamp recording from a CA1 PC (Vh=−70 mV). Left inset: higher magnification of a 1 s segment denoted by dashed lines. Right inset: single sIPSC (indicated by asterisks) overlaid from an actual experiment and from a simulation using the parameters obtained from the actual recording. B, a simulated 15 s trace using the parameters obtained from the recording in A. Inset: higher magnification of a 1 s segment marked by dashed lines. C, distribution of interevent intervals (corresponding to the frequency of 27.2 Hz of the events in A) used to generate the trace in B. D, plot of phasic Imean (P-Imean) cumulative average (calculated every second) showing no difference between experiment and simulation. E, peak, 10–90% rise time and τw distributions used to generate the trace in B, which were obtained by using in the simulation the mean and standard deviations of the respective parameters from the recording in A. F, average simulated sIPSC showing the difference when the peak and τw are both increased by 15% and 10%, respectively (grey line). G, when peak amplitude and τw are compared between two sets of simulations, they do not show statistical differences (peak: P = 0.174, n = 7; τw: P = 0.064, n = 7, unpaired t tests). The combined effect of the simultaneous, albeit non-significant, changes in the two parameters results in a significantly different phasic Imean(from −8.08 ± 0.53 to −10.0 ± 0.60 pA, n = 7, P = 0.031, unpaired t test).
Figure 6
Figure 6. Increased tonic inhibitory current during spontaneous bursts of sIPSCs
A, whole-cell voltage-clamp recording from a molecular layer interneuron in the presence of 3 mm kynurenic acid and 5 μm GABA (Vh=−70 mV) showing a spontaneous burst of sIPSCs (•). Lower panel shows expanded 5 s segments from the burst (•, 52 Hz) and control (○, 9 Hz) conditions. The dashed line indicates the baseline current in the control condition. B, simulated traces using the recorded parameters (frequency, peak amplitude, 10–90% rise time, τw and baseline noise) from the experimental condition. The dashed line indicates a baseline current of 0 pA. C, left panel: Gaussian fits to all-points histograms of the simulated traces using the parameters obtained from the experimental condition at 1-times and 1.5-times the maximum experimentally obtained event frequency during the burst. Shifts in baseline currents are as follows during the respective sIPSC frequencies: 10.4 Hz (−1.31 pA), 50.9 Hz (−2.69 pA) and at 75.7 Hz (−4.46 pA). Right panel: the difference in the tonic current measured in the experiment between the control condition and the spontaneous burst. GABA spillover must account for 13.4 pA of the increase in tonic current (16.1 pA − 2.69 pA).
Figure 7
Figure 7. Tonic inhibition increases during induced sIPSCs bursts
A, left panel: whole-cell voltage-clamp recording from a CA1 PC in the presence of 3 mm kynurenic acid and 5 μm GABA (Vh=−70 mV) where sucrose (300 mm, black line) was applied by low pressure from a pipette positioned close to the soma to induce a burst of IPSCs (•). Lower panel shows expanded 5 s segments from the burst (•, 68 Hz) and control (○, 19 Hz) conditions. The dotted line indicates the baseline current in the control condition. Right panel: Gaussian fits to the all-points histograms (dashed lines) of the two traces on the left indicating the shift in baseline current produced by application of sucrose (s.d. of the Gaussian fits: control 4.54 pA; burst 15.1 pA). B, left panel: simulated traces using the experimentally recorded sIPSC parameters. The dotted line indicates a baseline current of 0 pA. Right panel: Gaussian fits to all-points histograms of the simulated traces using the parameters obtained from the experimental condition at 1-times and 1.5-times the maximum experimentally obtained event frequency during the burst. The shifts in baseline current at the indicated frequencies are as follows: 21 Hz (−1.06 pA), 66 Hz (−2.93 pA) and at 102 Hz (−4.77 pA). GABA spillover should account for 20.1 pA of the increases in tonic current (23 pA – 2.93 pA). C, same as A but recorded from a Gabra5/Gabrd−/− double knockout mouse CA1 PC (Vh=−70 mV) that lacks tonic inhibition altogether. Note the absence of a tonic inhibitory current during the induced sIPSC burst (s.d. of the Gaussian fits: control 5.26 pA; burst 6.14 pA). D, linear regression between the burst-induced change in tonic and phasic currents indicating a high degree of correlation during a condition of increased vesicular GABA release (n = 14). Line represents the linear fit while dashed lines represent 95% confidence intervals. E, histogram plots of phasic and tonic current measured during induced bursts in wild type (WT) and in Gabra5/Gabrd−/− double knockout mice that lack tonic currents. (n = 14; *P < 0.001, unpaired t test).
Figure 8
Figure 8. Correlation between phasic and tonic inhibitory currents following blockade of action potential-dependent GABA release
A, whole-cell voltage-clamp recording from the same CA1 PC depicted in Fig. 1A showing phasic and tonic Imean simultaneously measured every second. The current in the presence of BMI was subtracted to yield a mean of 0 pA. Lines above the recordings indicate when TTX (5 μm) + CdCl2 (50 μm) and BMI (100 μm) were applied. B, normalized cross-correlation of phasic and tonic currents from the recording in A showing a positive correlation at 0 s. All neurons analysed (n = 6) showed a mean positive cross-correlation at 0 s of 0.40 ± 0.11. C, linear regression displaying 292 continuous seconds from the neuron depicted in A showing that phasic and tonic currents are correlated. Line represents the linear fit while dashed lines represent 95% confidence intervals
Figure 9
Figure 9. Correlated decrease in tonic and phasic inhibitions following a reduction in vesicular GABA content
A, whole-cell voltage-clamp recording from a CA1 PC in the presence of 3 mm kynurenic acid and 5 μm GABA (Vh=−70 mV) showing a 44.3 pA tonic current. Lower panel: 5 s expanded segment of the trace shown above (phasic Imean=−4.21 pA) B, same as A but in a CA1 PC recorded in a slice pre-incubated in 3.8 μm concanamycin A for 1 h. The tonic current is 14.55 pA. Lower panel: 5 s expanded segment of the trace shown above (phasic Imean=−0.50 pA). C, bar graphs of tonic (left) and phasic (right) currents recorded under three different conditions: control (▪), 100 nm (•) and 3.8 μm concanamycin A (▴). *P < 0.05 (one-way ANOVA, Dunnett's post hoc test). D, linear regression between the normalized phasic and tonic currents. Symbols correspond to the experimental conditions in C; open symbols are individual experiments, filled symbols are mean ±s.e.m. Continuous line represents the linear fit to the data points while the dashed lines represent the 95% confidence intervals (r = 0.493, P = 0.044).

References

    1. Attwell D, Barbour B, Szatkowski M. Nonvesicular release of neurotransmitter. Neuron. 1993;11:401–407. - PubMed
    1. Brickley SG, Cull-Candy SG, Farrant M. Development of a tonic form of synaptic inhibition in rat cerebellar granule cells resulting from persistent activation of GABAA receptors. J Physiol. 1996;497:753–759. - PMC - PubMed
    1. Bright DP, Aller MI, Brickley SG. Synaptic release generates a tonic GABAA receptor-mediated conductance that modulates burst precision in thalamic relay neurons. J Neurosci. 2007;27:2560–2569. - PMC - PubMed
    1. Brown N, Kerby J, Bonnert TP, Whiting PJ, Wafford KA. Pharmacological characterization of a novel cell line expressing human α4β3δ GABAA receptors. Br J Pharmacol. 2002;136:965–974. - PMC - PubMed
    1. Brunig I, Scotti E, Sidler C, Fritschy JM. Intact sorting, targeting, and clustering of gamma-aminobutyric acid A receptor subtypes in hippocampal neurons in vitro. J Comp Neurol. 2002;443:43–55. - PubMed

Publication types

LinkOut - more resources