. 2007 Aug 1;582(Pt 3):1099-124.
doi: 10.1113/jphysiol.2007.131995. Epub 2007 May 24.

Optical imaging of Ca2+-evoked fluid secretion by murine nasal submucosal gland serous acinar cells

Affiliations

Optical imaging of Ca2+-evoked fluid secretion by murine nasal submucosal gland serous acinar cells

Robert J Lee et al. J Physiol. .

Abstract

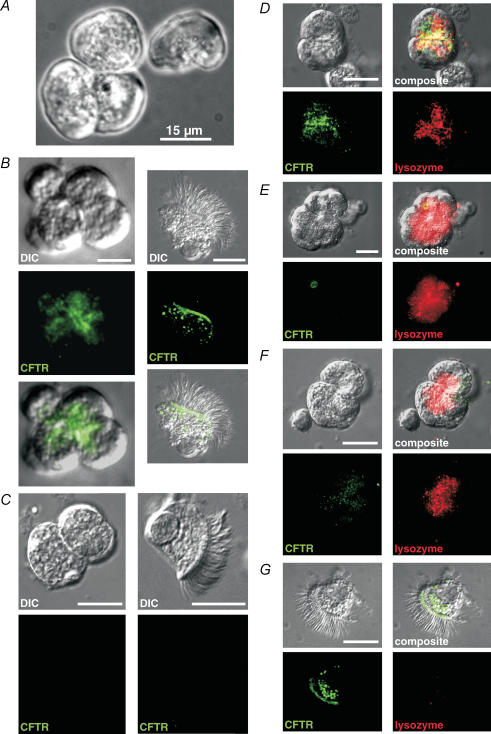
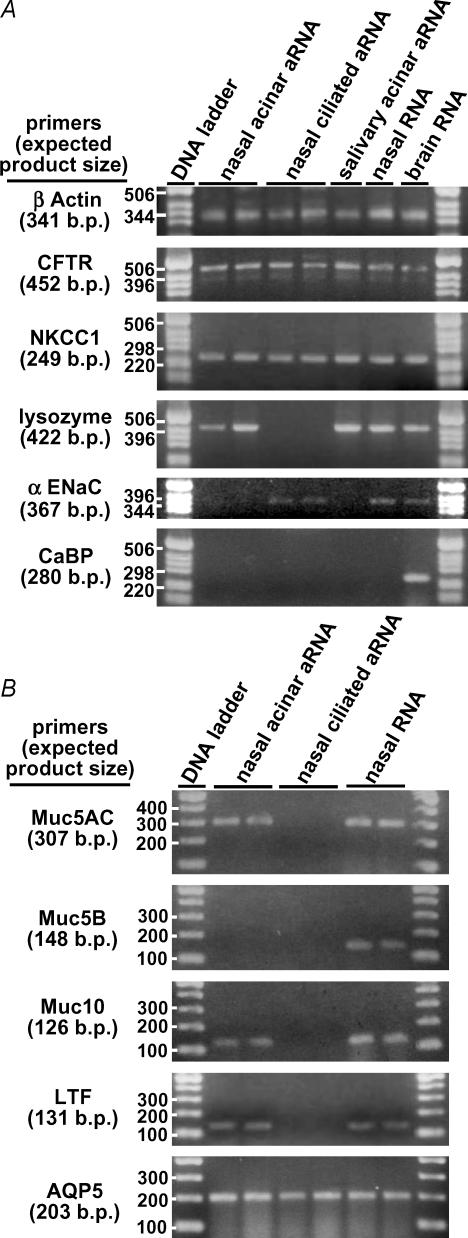
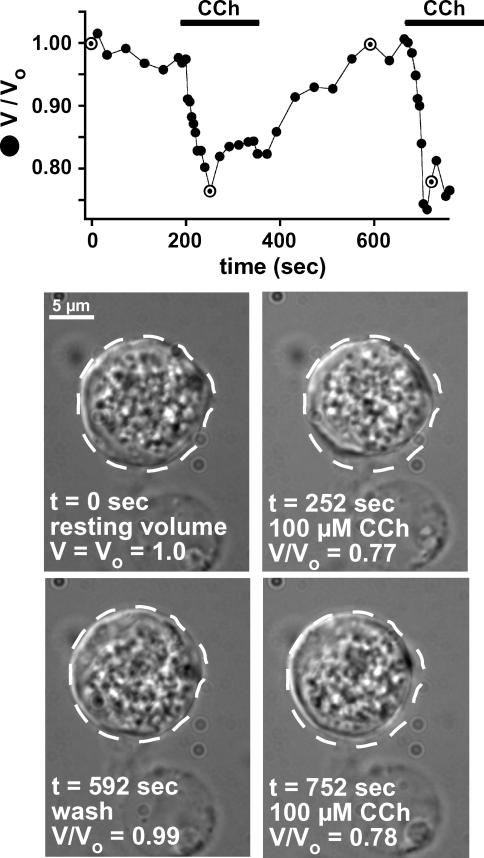
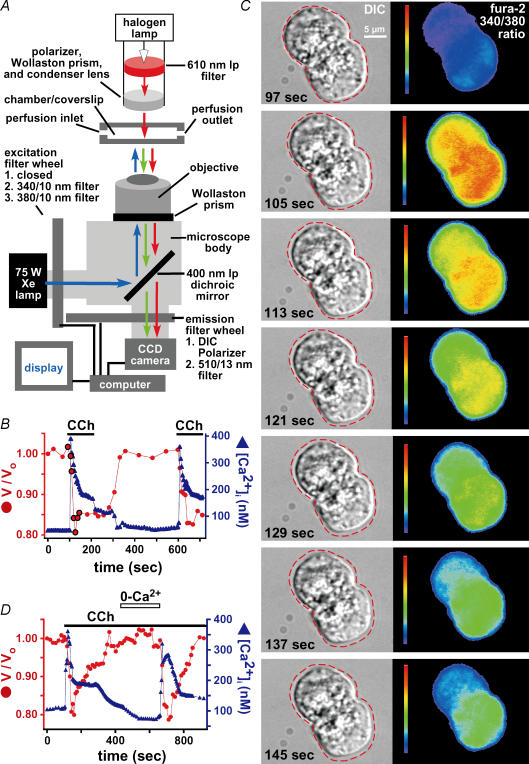
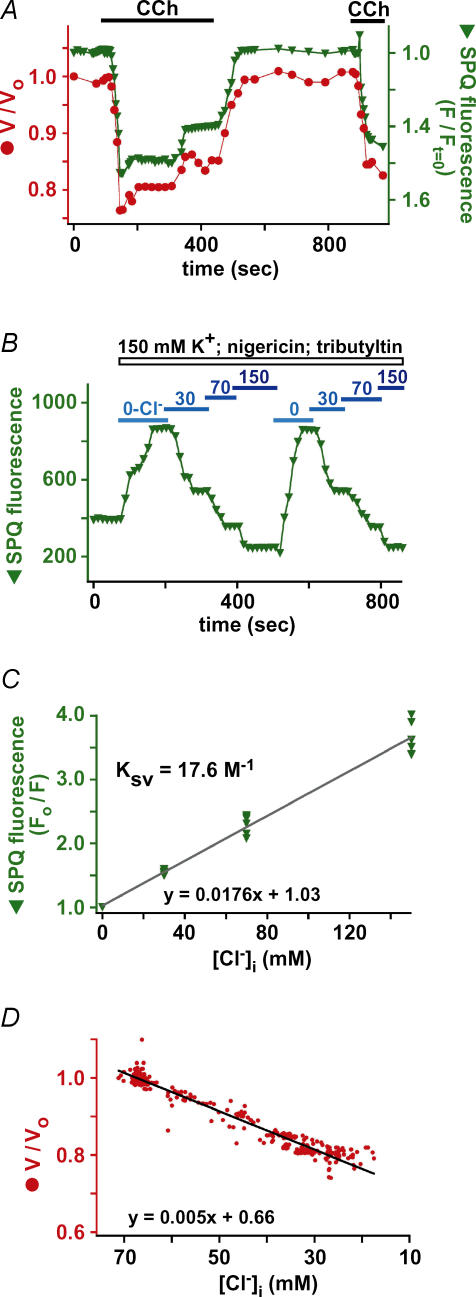
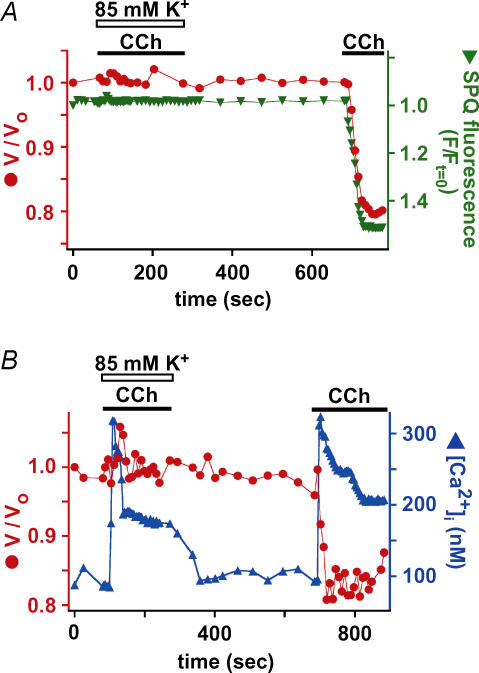
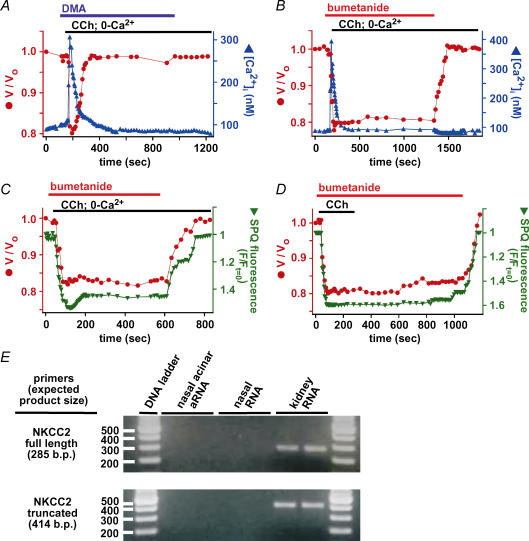
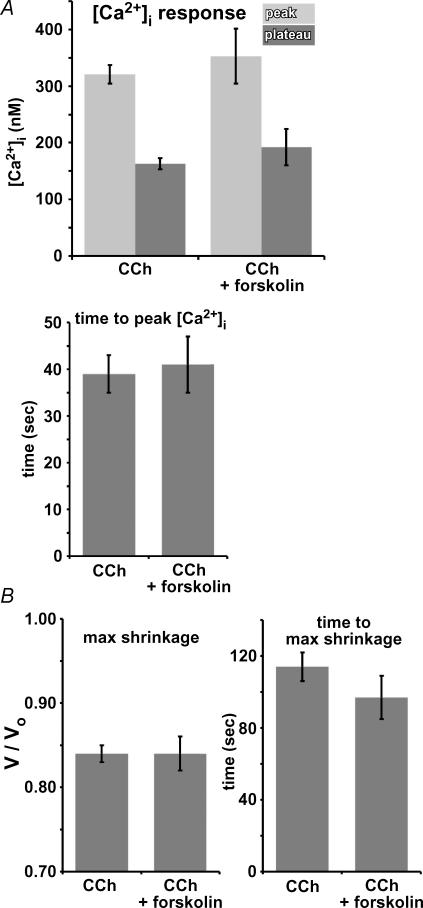
Airway submucosal glands are sites of high expression of the cystic fibrosis transmembrane conductance regulator (CFTR) Cl(-) channel and contribute to fluid homeostasis in the lung. However, the molecular mechanisms of gland ion and fluid transport are poorly defined. Here, submucosal gland serous acinar cells were isolated from murine airway, identified by immunofluorescence and gene expression profiling, and used in physiological studies. Stimulation of isolated acinar cells with carbachol (CCh), histamine or ATP was associated with marked decreases in cell volume (20 +/- 2% within 62 +/- 5 s) that were tightly correlated with increases in cytoplasmic Ca(2+) concentration ([Ca(2+)](i)) as revealed by simultaneous DIC and fluorescent indicator dye microscopy. Simultaneous imaging of cell volume and the Cl(-)-sensitive fluorophore SPQ indicated that the 20% shrinkage was associated with a fall of [Cl(-)](i) from 65 mm to 28 mm, reflecting loss of 67% of cell Cl(-) content, accompanied by parallel efflux of K(+). Upon agonist removal, [Ca(2+)](i) relaxed and the cells swelled back to resting volume via a bumetanide-sensitive Cl(-) influx pathway, likely to be NKCC1. Accordingly, agonist-induced serous acinar cell shrinkage and swelling are caused by activation of solute efflux and influx pathways, respectively, and cell volume reflects the secretory state of these cells. In contrast, elevation of cAMP failed to elicit detectible volume responses, or enhance those induced by submaximal [CCh], because the magnitude of the changes were likely to be below the threshold of detection using optical imaging. Finally, when stimulated with cholinergic or cAMP agonists, cells from mice that lacked CFTR, as well as wild-type cells treated with a CFTR inhibitor, exhibited identical rates and magnitudes of shrinkage and Cl(-) efflux compared with control cells. These results provide insights into the molecular mechanisms of salt and water secretion by lung submucosal glands, and they suggest that while murine submucosal gland fluid secretion in response to cholinergic stimulation can originate from CFTR-expressing serous acinar cells, it is not dependent upon CFTR function.


Figures

Figure 1
Figure 1. Isolated murine nasal acinar cells stain for CFTR and lysozyme using confocal immunofluorescence
A, isolated murine acinus and single acinar cell after collagenase digestion and before fixation. Cells were identified by the presence of small (< 1 μm) polarized secretory granules and an acinar morphology. B, fixed acinar cells (first column) stained for CFTR using monoclonal 24–1 antibody (recognizing a C-terminal epitope) and AF488 anti-mouse secondary antibody exhibited strong fluorescence at the apical region of the cells. The immunofluorescence appeared strongest at the apical membrane where cells were joined together, but also extended somewhat into the apical pole of the cells, consistent with CFTR present in secretory vesicles and/or CFTR being trafficked to the plasma membrane. Fixed ciliated epithelial cells (second column) exposed to the same antibody conditions showed bright apical membrane fluorescence. C, CFTR immunofluorescence was absent in cells isolated from cftrtm1Unc−/− knockout mice. Fluorescence recorded with exposure/camera settings identical to those in B. Intensity was equivalent to background levels observed in reactions containing secondary antibody alone (not shown). D, cells isolated from WT mice costained for CFTR and lysozyme (using polyclonal anti-lysozyme antibody and AF568 anti-rabbit secondary antibody). Lysozyme immunofluorescence consistently appeared localized to the secretory granules. E, cells isolated from the cftrtm1Unc−/− knockout mouse lacked CFTR immunofluorescence, but stained brightly for lysozyme. F, cells isolated from WT mice incubated with CFTR antibody in the presence of C-terminal CFTR peptide (0.01 mg ml −1, ∼10-fold excess by weight) did not display strong CFTR fluorescence but exhibited normal lysozyme immunofluorescence. G, ciliated epithelial cells display CFTR immunofluoresence, but did not exhibit lysozyme immunofluorescence. All scale bars represent 15 μm.
Figure 2
Figure 2. Isolated mouse acinar cells express mRNA for serous acinar cell-specific markers
A, Eberwine aRNA amplification reactions were performed on 3–4 nasal acinar cells, ciliated nasal epithelial cells, or salivary gland acinar cells as indicated. B, isolated mouse nasal acinar cells express Muc5AC and Muc10, but not the mucous cell marker Muc5B. Acinar cells also expressed the serous cell proteins LTF and AQP5.
Figure 3
Figure 3. Serous acinar cells shrink in response to CCh
Time course of serous acinar cell volume in response to repetitive stimulation with 100 μm CCh. Images below represent the nasal acinar cell at specific time points from the trace shown, which are highlighted on the graph. Dotted line representing the outline of the cell at time 0 is superimposed on the subsequent next four images to illustrate cell volume compared to cell volume at t = 0. Results typical of 11 similar experiments.
Figure 4
Figure 4. CCh-induced serous acinar cell shrinkage is accompanied by an increase in [Ca2+]i
A, microscope set-up for simultaneous DIC and quantitative low-light fluorescence microscopy to measure cell volume and [Ca2+]i using fura-2. See Methods for complete description. B, simultaneous cell volume and [Ca2+]i responses in single serous acinar cells stimulated with 100 μm CCh as indicated. Cell volume is plotted as volume/volume at time 0 (V/Vo)). A representative response is shown (n = 19). Highlighted points on the graph represent time points shown in C. C, time-lapse images of the volume and [Ca2+]i responses to CCh in the two acinar cells imaged in the experiment shown in B. The background-subtracted fura-2 340/380 ratio images illustrate the change in [Ca2+]i. The dotted line represents the outline of the cell at t = 97 s (immediately before CCh exposure), which was then superimposed upon subsequent images to illustrate cell volume compared to volume at t = 97 s. Note that the peak [Ca2+]i increase (t = 105 s) precedes the peak shrinkage (t = 129 s). D, in 10% of cells, stimulation with CCh raised [Ca2+]i only transiently. This was accompanied by cell shrinkage followed by swelling back to near-resting volume. In the continued presence of agonist, removal (∼100 s) and re-introduction of extracellular Ca2+ induced a second, similar response.
Figure 5
Figure 5. CCh induces cell shrinkage and increased [Ca2+]i in a dose-dependent manner
A, representative experiment in which a serous acinar cell was stimulated successively with 100 nm and 1 μm CCh (representative of 3 experiments). B, mean maximal shrinkage and time to maximal shrinkage are plotted for different concentrations of CCh (n = 10, 22, 19 and 28 for 100 nM, 1 μM, 10 μM and 100 μM CCh, respectively). C, mean peak and plateau [Ca2+]i responses and time to peak [Ca2+]i response plotted for 100 nM (n = 10), 1 μM (n = 20), 10 μM (n = 9) and 100 μM CCh (n = 19). After stimulation with 100 nM CCh (n = 10), the peak [Ca2+]i increase was 145 ± 12 nM within 53 ± 2 s followed by a plateau [Ca2+]i of 132 ± 10 nM. After stimulation with 1 μM CCh (n = 20), [Ca2+]i peaked at 321 ± 16 nM within 39 ± 4 s (P < 0.001 for peak [Ca2+]i and P = 0.07 for time to peak compared to 100 nM CCh) followed by a plateau [Ca2+]i of 163 ± 10 nM (P = 0.3 compared to 100 nM CCh). Cells exposed to 10 μM CCh (n = 9) exhibited a similar peak [Ca2+]i of 355 ± 17 nM (P = 0.2 compared to 1 μM CCh) within 29 ± 2 s (P = 0.1 compared to 1 μM CCh), followed by a plateau [Ca2+]i of 214 ± 14 nM (P = 0.01 compared to 1 μM CCh). The maximal [CCh] used (100 μM as reported above) induced a peak [Ca2+]i= 447 ± 15 nM within 25 ± 2 s (P = 0.1 and 0.4, respectively, compared to 10 μM CCh) along with a plateau of 240 ± 10 nM [Ca2+]i (P = 0.3 compared to 10 μM CCh). Significance P-values (compared to results from 10-fold lower [CCh]) are indicated by asterisks (*P = 0.1; **P = 0.01).
Figure 6
Figure 6. Changes in serous cell volume are tightly coupled to changes in [Ca2+]i
A, responses of cell volume and [Ca2+]i to stimulation with 100 μm CCh in 0-Ca2+–1 mm EGTA solution, with extracellular Ca2+ reintroduced in the presence of CCh (representative of n = 10 cells). B, after stimulation with 100 μm CCh in 0-Ca2+ solution, neither cell volume nor [Ca2+]i responded upon washout and reintroduction of CCh in the continued absence of extracellular Ca2+ (representative of n = 5 cells). C, after depletion of intracellular Ca2+ stores by stimulation in 0-Ca2+–1 mm EGTA solution, reintroduction of extracellular Ca2+ in absence of agonist induced a small transient spike in [Ca2+]i that was sufficient to induce a marked volume change (n = 4). D, response of cell volume to 100 μm CCh of cells incubated for 30 min in 5 mm BAPTA-AM. E, cells (obtained from the same preparation used in D) incubated for 30 min in 5 mm BCECF-AM shrank normally when stimulated with 100 μm CCh. F, reversal of CCh (10 μm)-induced changes in [Ca2+]i and cell volume by atropine (100 μm). G, ionomycin (5 μm) was sufficient to induce an agonist independent rise in [Ca2+]i and decrease in cell volume (n = 3 cells). Identical results were obtained with 5 μm A23187 (data not shown, n = 3 cells).
Figure 7
Figure 7. Histamine and ATP elevate [Ca2+]i and induce cell volume changes similar to those observed with CCh
A, stimulation with 100 μm histamine, as indicated. Representative of n = 9 cells. B, stimulation with 100 μm ATP as indicated. Representative of n = 8 cells.
Figure 8
Figure 8. Changes in [Cl]i parallel observed cell volume changes
A, simultaneous determination of cell volume and SPQ fluorescence intensity (normalized to the intensity at t = 0 (F/Ft = 0) and plotted inversely) changes in response to 100 μm CCh. B, representative SPQ calibration experiment in acinar cells. C, composite Stern–Volmer plot of 6 calibration experiments. All values are represented as fluorescence in 0-Cl/fluorescence (F0/F). Average F0/F-values were 1.55 ± 0.02 for 30 mm Cl, 2.29 ± 0.06 for 70 mm Cl, and 3.64 ± 0.1 for 150 mm Cl. F0/F was 2.16 ± 0.06 under resting conditions before calibration, indicating resting [Cl]i= 64.5 ± 4 mm. The quenching constant, KSV, determined from the slope of the least squares regression fit, was 17.6 m−1 (standard deviation (s.d.) = 0.5 m−1). D, composite plot of simultaneous [Cl]i and cell volume determinations from 9 experiments during CCh stimulation that demonstrates tight correlation between the two parameters. Data were fitted with least squares linear regression, with slope equal to 5.56 m−1 (s.d. of slope = 0.210−3m−1).
Figure 9
Figure 9. K+ efflux is required for CCh-induced cell shrinkage and Cl loss
Simultaneous determinations of cell volume and SPQ fluorescence (A; n = 4) or [Ca2+]i (B; n = 10) during stimulation by 100 μm CCh in bathing solution containing either 85 mm K+ (as indicated) or normal extracellular K+ (5 mm).
Figure 10
Figure 10. Cell volume recovery is mediated by solute uptake via a NKCC-dependent pathway
Simultaneous determinations of cell volume and [Ca2+]i (A and B) or SPQ fluorescence (C and D) during stimulation by 100 μm CCh in the absence (A–C) or presence (D) of extracellular [Ca2+]i in the presence of the Na+/H+ exchanger inhibitor DMA (30 μm; A) or the NKCC cotransporter inhibitor bumetanide (100 μm; B–D). Experiments shown in A–D are representative of 17, 15, 5 and 4 identical experiments, respectively. E, expression of NKCC2 was not detected in RNA from either isolated nasal serous acinar cells or from intact nasal tissue, whereas it was detected using both primer sets and RNA extracted from murine kidney.
Figure 11
Figure 11. CFTR is not required for the agonist-stimulated Cl loss
Simultaneous determinations of cell volume and [Ca2+]i (A) or SPQ fluorescence (B) in serous acinar cells from cftrtm1unc−/− mice in response to 100 μm CCh. Representative of n = 15 (A) and 6 (B) experiments. C, representative in vivo calibration experiment of SPQ fluorescence in serous acinar cells from cftrtm1unc−/− mice. D, composite Stern–Volmer plot of 3 calibration experiments. Average F0/F values obtained were 1.55 ± 0.03 for 30 mm Cl, 2.32 ± 0.01 for 70 mm Cl, and 3.60 ± 0.06 for 150 mm Cl. The Stern–Volmer plot yielded KSV= 17.3 m−1 (standard deviation of the slope of the fitted line = 0.4 m−1), with resting [Cl]i= 66 ± 2.3 mm (F0/F = 2.17 ± 0.04). E, composite data from 6 experiments during stimulation of serous acinar cells from cftrtm1unc−/− mice with 100 μm CCh showing correlation of [Cl]i, determined from SPQ fluorescence, and cell volume. The slope of the fit was 5.32 m−1 (s.d.= 0.0710−3m−1). F, lack of effect of the CFTR inhibitor CFTRinh172 (10 μm) on cell volume (n = 15) or [Cl]i (SPQ fluorescence; n = 6) responses of serous acinar cells from WT mice.
Figure 12
Figure 12. Stimulation of serous acinar cells with 1 μm CCh in the presence of increased [cAMP]i does not increase the rate or magnitude of cell volume changes or [Ca2+]i dynamics compared to control cells
A, peak [Ca2+]i (top panel, lighter grey bars), plateau [Ca2+]i (top panel, darker grey bars), and time to peak [Ca2+]i (bottom panel) responses to 1 μm CCh with or without 15 μm forskolin pretreatment. B, maximal shrinkage (first panel) and time to maximal shrinkage (second panel) upon stimulation with 1 μm CCh ± pretreatment with 15 μm forskolin.

References

    1. Ballard ST, Fountain JD, Inglis SK, Corboz MR, Taylor AE. Chloride secretion across distal airway epithelium: relationship to submucosal gland distribution. Am J Physiol Lung Cell Mol Physiol. 1995;268:L526–L531. - PubMed
    1. Ballard ST, Inglis SK. Liquid secretion properties of airway submucosal glands. J Physiol. 2004;556:1–10. - PMC - PubMed
    1. Ballard ST, Trout L, Bebok Z, Sorscher EJ, Crews A. CFTR involvement in chloride, bicarbonate, and liquid secretion by airway submucosal glands. Am J Physiol Lung Cell Mol Physiol. 1999;277:L694–L699. - PubMed
    1. Berger JT, Voynow JA, Peters KW, Rose MC. Respiratory carcinoma cell lines. MUC genes and glycoconjugates. Am J Respir Cell Mol Biol. 1999;20:500–510. - PubMed
    1. Boucher RC. New concepts of the pathogenesis of cystic fibrosis lung disease. Eur Respir J. 2004;23:146–158. - PubMed

Publication types

LinkOut - more resources