. 2007 Aug;148(8):4091-101.
doi: 10.1210/en.2007-0240. Epub 2007 May 24.

Estrogen signaling via a linear pathway involving insulin-like growth factor I receptor, matrix metalloproteinases, and epidermal growth factor receptor to activate mitogen-activated protein kinase in MCF-7 breast cancer cells

Affiliations

Estrogen signaling via a linear pathway involving insulin-like growth factor I receptor, matrix metalloproteinases, and epidermal growth factor receptor to activate mitogen-activated protein kinase in MCF-7 breast cancer cells

Robert X-D Song et al. Endocrinology. 2007 Aug.

Abstract

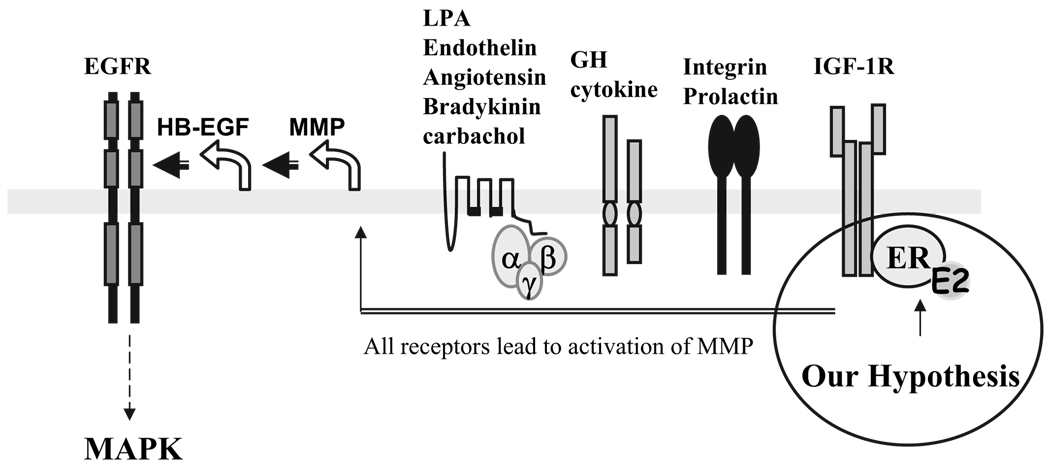
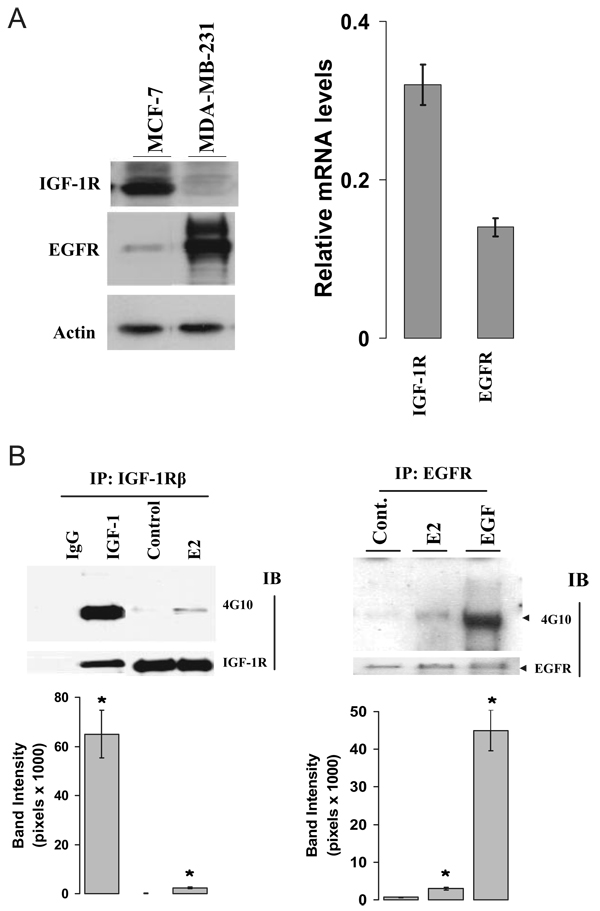
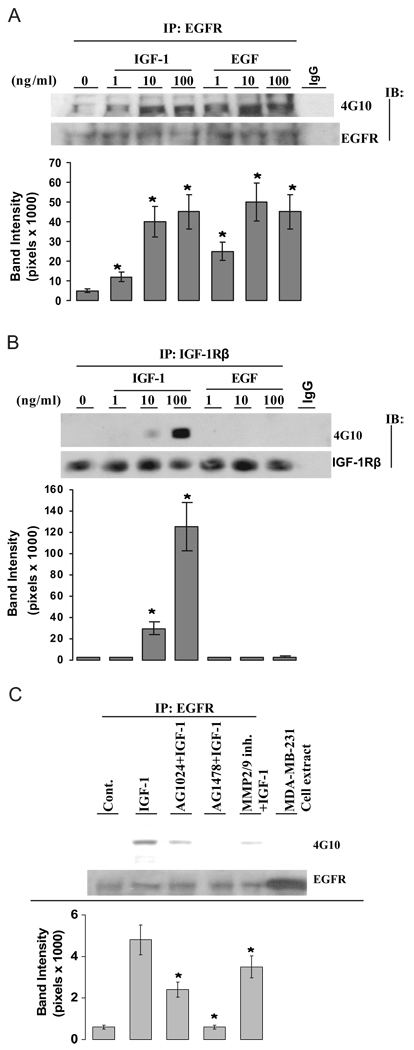
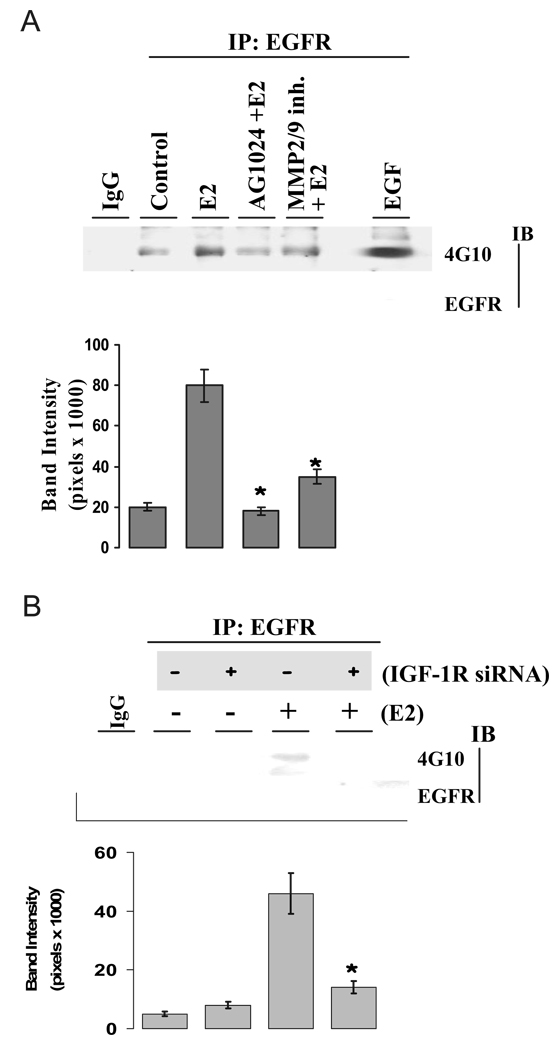
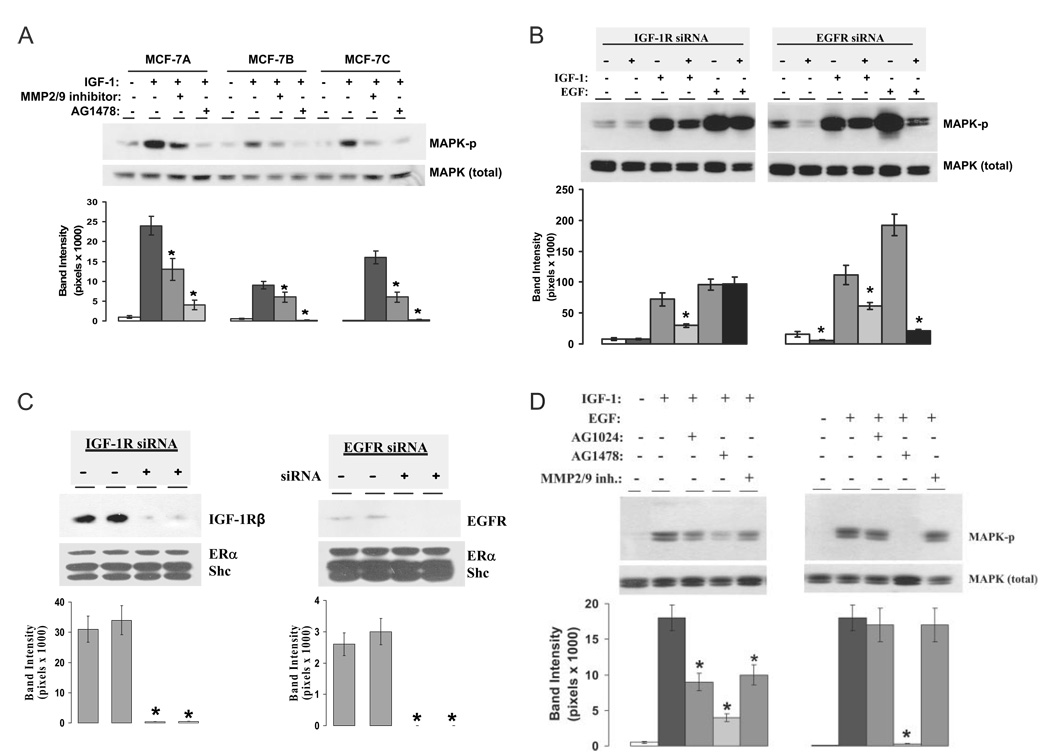
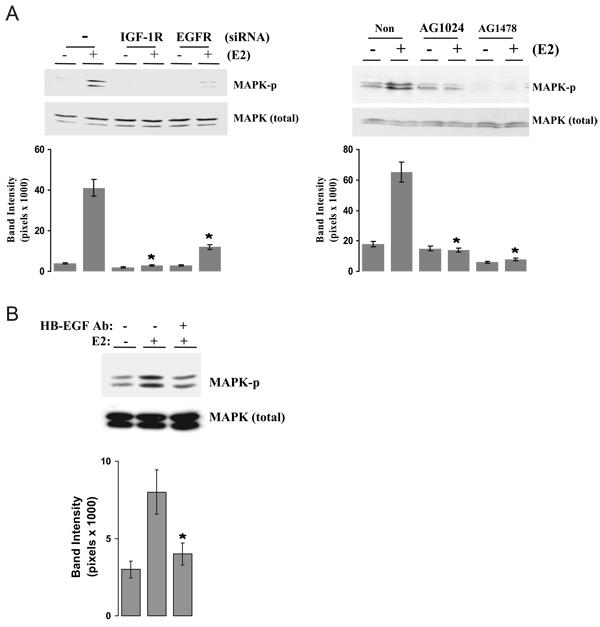
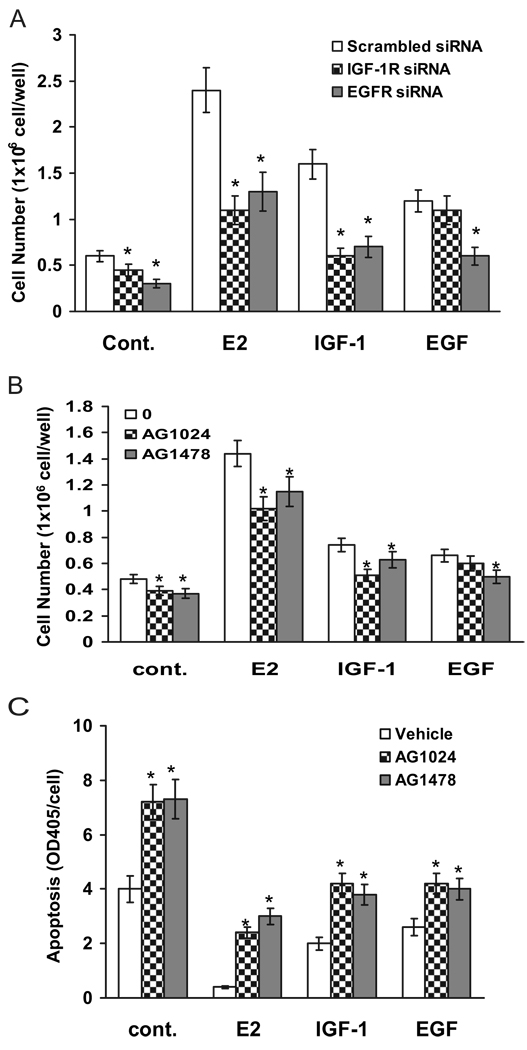
We present an integrated model of an extranuclear, estrogen receptor-alpha (ERalpha)-mediated, rapid MAPK activation pathway in breast cancer cells. In noncancer cells, IGF-I initiates a linear process involving activation of the IGF-I receptor (IGF-IR) and matrix metalloproteinases (MMP), release of heparin-binding epidermal growth factor (HB-EGF), and activation of EGF receptor (EGFR)-dependent MAPK. 17beta-Estradiol (E2) rapidly activates IGF-IR in breast cancer cells. We hypothesize that E2 induces a similar linear pathway involving IGF-IR, MMP, HB-EGF, EGFR, and MAPK. Using MCF-7 breast cancer cells, we for the first time demonstrated that a sequential activation of IGF-IR, MMP, and EGFR existed in E2 and IGF-I actions, which was supported by evidence that the selective inhibitors of IGF-IR and MMP or knockdown of IGF-IR all inhibited E2- or IGF-I-induced EGFR phosphorylation. Using the inhibitors and small inhibitory RNA strategies, we also demonstrated that the same sequential activation of the receptors occurred in E2-, IGF-I-, but not EGF-induced MAPK phosphorylation. Additionally, a HB-EGF neutralizing antibody significantly blocked E2-induced MAPK activation, further supporting our hypothesis. The biological effects of sequential activation of IGF-IR and EGFR on E2 stimulation of cell proliferation were also investigated. Knockdown or blockade of IGF-IR significantly inhibited E2- or IGF-I-stimulated but not EGF-induced cell growth. Knockdown or blockade of EGFR abrogated cell growth induced by E2, IGF-I, and EGF, indicating that EGFR is a downstream molecule of IGF-IR in E2 and IGF-I action. Together, our data support the novel view that E2 can activate a linear pathway involving the sequential activation of IGF-IR, MMP, HB-EGF, EGFR, and MAPK.


Figures

FIG. 1
FIG. 1
Model for EGFR-dependent MAPK activation. EGFR acts as a central point linking all upstream ligand signals on MAPK activation. The ligands that lead to the EGFR-dependent MAPK activation can be lysophosphatidic acid (LPA), endothelin, carbachol, angiotensin, bradykinin, GH, prolactin, integrin, and IGF-I. All ligands mediated by their membrane receptors induced MAPK activation via a linear activation of MMP2 and -9, cleavage of HB-EGF, and activation of the EGFR. The circle on the right is our proposed pathway of E2-induced MAPK activation. The E2/ERα complex on the cell membrane interacts with IGF-IR and co-opts the IGF-IR pathway to signal through MMP2 and -9, HB-EGF, and the EGFR, leading to the MAPK activation.
FIG. 2
FIG. 2
E2 activated both IGF-IR and EGFR in MCF-7 cells. A, Levels of IGF-IR and EGFR expression in MCF-7 cells. Both MCF-7 and MDA-MB-231 cells were extracted from cells at 80% confluence and processed for assessment of IGF-IR andEGFRexpression using Western blot (left) and RT-PCR method (right). B, Activation of IGF-IR and EGFR by E2. MCF-7 cells cultured in 1% DCC medium were stimulated with vehicle, 0.1 nM E2, 20 ng/ml IGF-I, or 20 ng/ml EGF for 5 min. Protein lysates were subjected to immunoprecipitation with anti-IGF-IR (left) or anti-EGFR (right) antibodies with subsequent immunoblotting using an anti-phosphotyrosine antibody (4G10) on Western blot. The nonspecific monoclonal IgG antibody was included in the immunoprecipitation step as a negative control. The membranes were further blotted with either anti-β-domain of IGF-IR or anti-EGFR antibodies for total receptor protein loading. All experiments were done at least three times. *, P < 0.05 compare with the vehicle-treated control.
FIG. 3
FIG. 3
IGF-IR is an upstream molecule of EGFR. A, IGF-I increased the phosphorylation status of the EGFR. Quiescent MCF-7 cells were treated with vehicle, IGF-I, or EGF at doses indicated for 5 min. Lysates were immunoprecipitated with anti-EGFR antibodies. The protein phosphorylation status was detected by 4G10 antibody. The membranes were further blotted with anti-EGFR antibodies for total receptor protein loading. The nonspecific monoclonal IgG antibody was included in immunoprecipitation step as negative control. B, IGF-I, but not EGF, increased the phosphorylation status of the IGF-IR. Cells were challenged with both IGF-I and EGF at doses indicated. The IGF-IR phosphorylation status was assayed as described in Materials and Methods. The membranes were further blotted with anti-IGF-IR antibodies for total receptor protein loading. The nonspecific monoclonal IgG antibody was included in immunoprecipitation step as negative control. C, Effect of selective inhibitors on IGF-I-induced EGFR activation. Cells were pretreated with 1 µm AG1024, 1 µm AG1478, or 10 µm MMP2/9 inhibitor for 30 min and then treated with vehicle or IGF-I at 20 ng/ml for 5 min. The phosphorylation status of EGFR was assessed as above. The lower panels represent the protein loading. The cell lysate from MDA-MB-231 cells was loaded on Western blot to monitor the EGFR molecular weight. Band intensity of EGFR phosphorylation (4G10) in pixels was normalized to the protein loading (EGFR) in the experiment (mean ± sem; n = 3 independent experiments). *, P < 0.05 compared with the vehicle-treated control (A and B) or compared with IGF-I-treated cells (C).
FIG. 4
FIG. 4
E2-induced EGFR activation involves IGF-IR and MMP. A and B, E2-induced EGFR phosphorylation is dependent on both IGF-IR and MMP. Cells were pretreated with 1 µm AG1024 and 10 µm MMP2/9 inhibitor for 30 min (A) or transiently transfected with nonspecific scrambled siRNA (−) or siRNA against IGF-IR (+) for 3 d (B). Then cells were challenged with vehicle or E2 at 0.1 nm for 5 min. The phosphorylation status of EGFR was assessed as above. Quantitative analysis of the EGFR activation is expressed as band intensity in pixels (lower panels), which are further normalized to the protein loading (EGFR) in the same experiment (mean ± sem; n = 5 independent experiments). *, P < 0.05 compared with E2-treated cells (A) or with E2-treated, scrambled siRNA (−) expression cells (B).
FIG. 5
FIG. 5
IGF-IR is an upstream molecule on EGFR-dependent MAPK activation. A, Effect of AG1478 and MMP2/9 inhibitor on IGF-I-induced MAPK activation in MCF-7 variants. Three variants of MCF-7 cells were pretreated with MMP2/9 inhibitor or AG1478 for 30 min and then treated with vehicle or IGF-I for 15 min. The phosphorylation status and total MAPK protein loading were assayed using specific anti-active and anti-MAPK antibodies. B, Knockdown of IGF-IR or EGFR with selective siRNA in MCF-7 cells. Cells were transiently transfected with nonspecific scrambled siRNA (−) or siRNA against IGF-IR and EGFR (+). On d 3, whole-cell extracts in duplicate per treatment were prepared and analyzed by Western blotting as described in Materials and Methods. The PVDF membranes were probed for the expression of IGF-IR (left) or EGFR (right). On each membrane, the protein expression of ERα and Shc was also probed to monitor the specificity of the protein knockdown by siRNA. Quantitative analysis of the protein knockdown is expressed as band intensity in pixels. *, P < 0.05 compared with the protein levels of control siRNA expression group. C, Activation of IGF-IR leads to phosphorylation of both EGFR-dependent and EGFR-independent MAPK. MCF-7 cells were transiently transfected with scrambled siRNA (−) or siRNA against IGF-IR and EGFR(+) for 3 d and then treated with vehicle, IGF-I, or EGF at 20 ng/ml for 15 min. The phosphorylation status and total MAPK were assayed using specific anti-phospho-MAPK or anti-MAPK antibodies (top). D, Effect of selective inhibitors on ligand-induced MAPK activation. Cells were pretreated with 1 µm AG1024, 1 µm AG1478, and 10 µm MMP2/9 inhibitor for 30 min and then challenged with vehicle, IGF-I, or EGF at 20 ng/ml for 15 min. The MAPK phosphorylation status was assayed using cell extracts. Band intensity of MAPK phosphorylation in pixels was normalized to the MAPK protein loading in A, C, and D (mean ± sem; n = 3 independent experiments for each figure). *, P < 0.05 comparing the inhibitor or siRNA knockdown of IGF-I- or EGF-treated group with the IGF-I- or EGF-treated alone (A, C, and D).
FIG. 6
FIG. 6
IGF-IR, EGFR, and HB-EGF involvement in E2-induced MAPK activation. A, Knockdown or blockade of IGF-IR and EGFR on E2-induced MAPK activation. MCF-7 cells were transiently transfected with nonspecific scrambled siRNA (−) or siRNA against IGF-IR and EGFR (+) (left) or pretreated with either 1 µm AG1024 or AG1478 for 30 min (right). Then cells were challenged with vehicle or 0.1 nm E2 for 15 min. The MAPK phosphorylation was assayed. B, HB-EGF is involved in E2-induced MAPK activation. Cells were pretreated with anti-HB-EGF neutralizing antibodies at 10 µg/ml and then challenged with vehicle or E2 for 15 min. The MAPK phosphorylation was assayed. Band intensity of MAPK phosphorylation in pixels was normalized to the MAPK protein loading in A and B (mean ± sem; n = 3 independent experiments for each figure). *, P < 0.05 compared with E2-treated, control siRNA expression cells (A, left) or the E2-treated alone (A, right, and B).
FIG. 7
FIG. 7
Linear activation of IGF-IR and EGFR is involved in E2-induced cell growth and cell death protection. A and B, Knockdown or blockade of IGF-IR and EGFR on ligand-induced cell growth. Cells were transiently transfected with nonspecific scrambled siRNA or siRNA against IGF-IR and EGFR (A) or pretreated with either 1 µm AG1024 or 1 µm AG1478 for 30 min (B). Then the cells were challenged with vehicle, E2 at 0.1 nm, 20 ng/ml IGF-I, or 20 ng/ml EGF for 4 d. Cell numbers were counted at the end of experiments. C, Effect of selective inhibitors on E2-induced cell death protection. MCF-7 cells were pretreated with either 1 µm AG1024 or 1 µm AG1478 for 30 min and then treated with vehicle, 0.1 nm E2, 20 ng/ml IGF-I, or 20 ng/ml EGF. Cell apoptosis was assayed on d 4 as described in Materials and Methods. Data are mean ± sem (n = 6). *, P < 0.05 comparing the siRNA-transfected or inhibitortreated cells with the growth factor-treated alone.

References

    1. Ali S, Coombes RC. Estrogen receptor α in human breast cancer: occurrence and significance. J Mammary Gland Biol Neoplasia. 2000;5:271–281. - PubMed
    1. Yee D, Lee AV. Crosstalk between the insulin-like growth factors and estrogens in breast cancer. J Mammary Gland Biol Neoplasia. 2000;5:107–115. - PubMed
    1. Cheskis BJ. Regulation of cell signalling cascades by steroid hormones. J Cell Biochem. 2004;93:20–27. - PubMed
    1. Alexaki VI, Charalampopoulos I, Kampa M, Vassalou H, Theodoropoulos P, Stathopoulos EN, Hatzoglou A, Gravanis A, Castanas E. Estrogen exerts neuroprotective effects via membrane estrogen receptors and rapid Akt/NOS activation. FASEB J. 2004;18:1594–1596. - PubMed
    1. Nicholson S, Wright C, Sainsbury JR, Halcrow P, Kelly P, Angus B, Farndon JR, Harris AL. Epidermal growth factor receptor (EGFr) as a marker for poor prognosis in node-negative breast cancer patients: neu and tamoxifen failure. J Steroid Biochem Mol Biol. 1990;37:811–814. - PubMed

Publication types

MeSH terms