. 2007 Jun;130(Pt 6):1643-52.
doi: 10.1093/brain/awm095.

Heme oxygenase-1 exacerbates early brain injury after intracerebral haemorrhage

Affiliations

Heme oxygenase-1 exacerbates early brain injury after intracerebral haemorrhage

Jian Wang et al. Brain. 2007 Jun.

Abstract

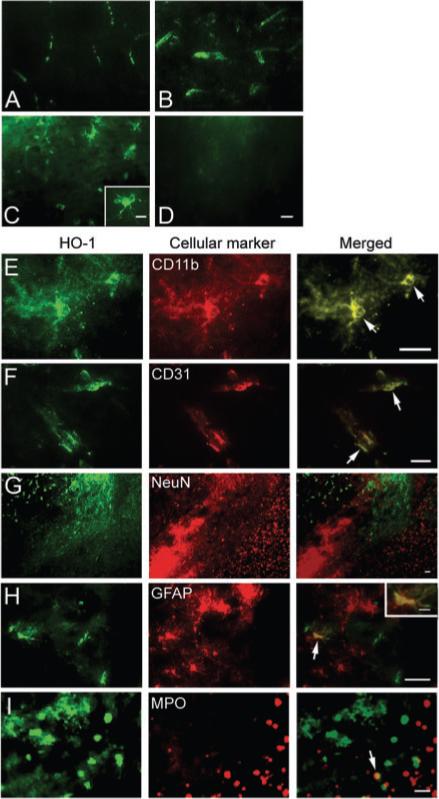
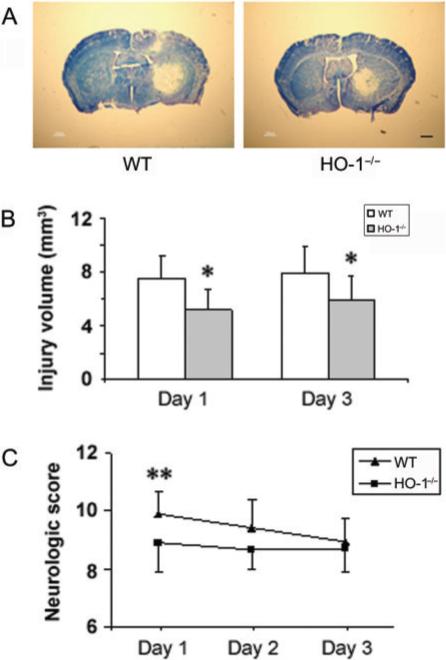
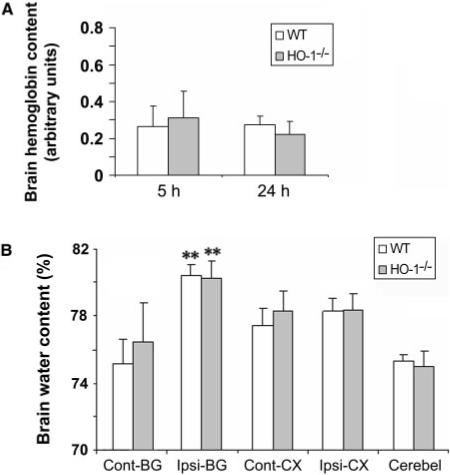
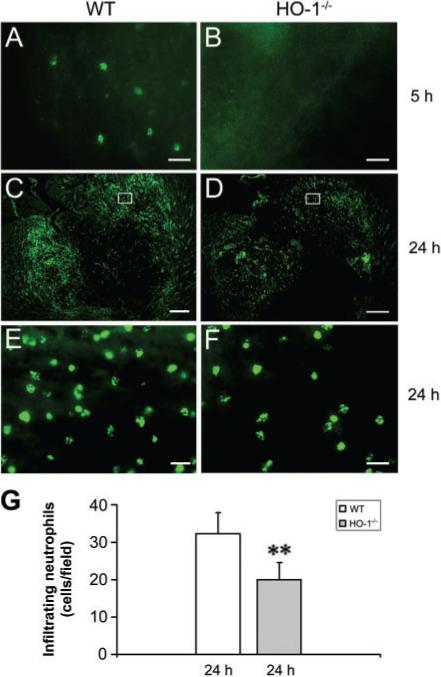
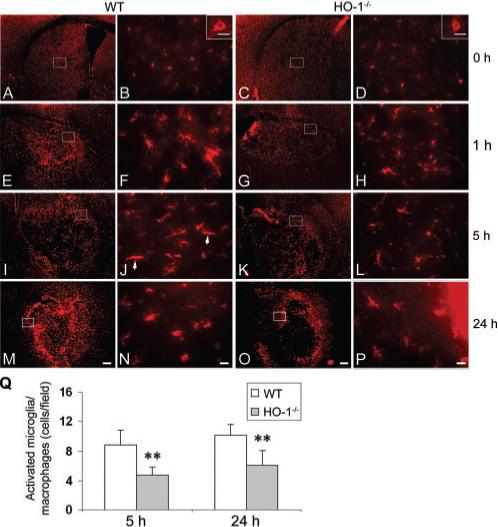
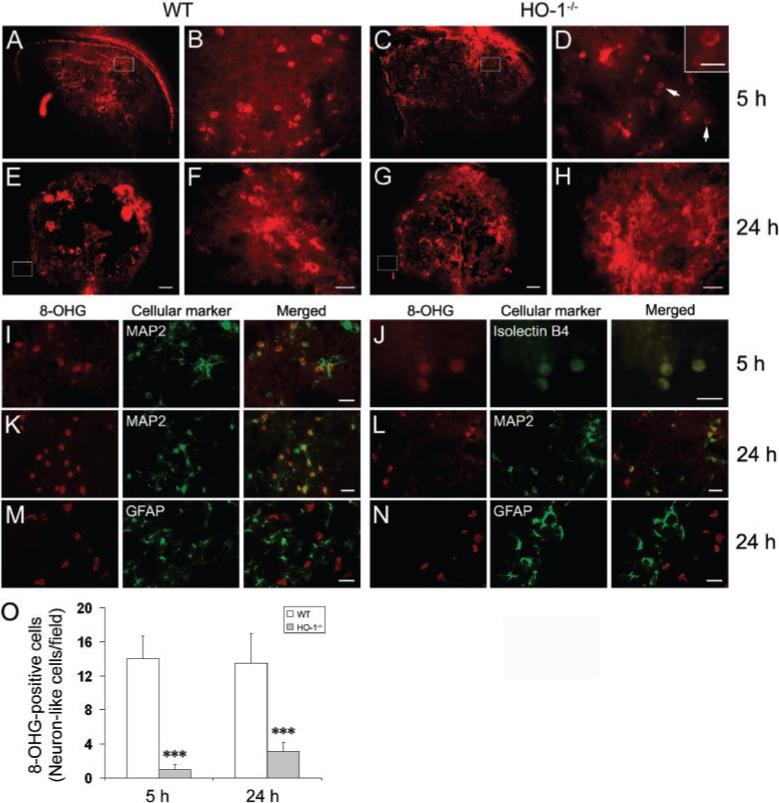
Because heme oxygenase (HO) is the rate limiting enzyme in the degradation of the pro-oxidant hemin/heme from blood, here we investigated the contribution of the inducible HO-1 to early brain injury produced by intracerebral haemorrhage (ICH). We found that after induction of ICH, HO-1 proteins were highly detectable in the peri-ICH region predominantly in microglia/macrophages and endothelial cells. Remarkably, the injury volume was significantly smaller in HO-1 knockout (HO-1-/-) mice than in wild-type controls 24 and 72 h after ICH. Although the brain water content did not appear to be significantly different, the protection in HO-1-/- mice was associated with a marked reduction in ICH-induced leucocyte infiltration, microglia/macrophage activation and free radical levels. These data reveal a previously unrecognized role of HO-1 in early brain injury after ICH. Thus, modulation of HO-1 signalling should be assessed further in clinical settings, especially for haemorrhagic states.


Figures

Fig. 1
Fig. 1
HO-1 immunoexpression and cellular localization after ICH. HO-1 immunoexpression was characterized in collagenase-induced ICH mouse brain. (A) In sham-operated mice, HO-1 immunoreactivity was primarily observed in vascular-like structures. After ICH, increased HO-1 immunoreactivity was observed in vascular-like structures in areas adjacent to the site of haematoma 5 h post-ICH (B), and was present in microglia/macrophage-like cells in the same region 24 h post-ICH (C). The inset in C (scale bar, 10 μm) is a representative HO-1-expressing cell at higher magnification. (D) No immunoreactivity was observed in HO-1−/− mice. Scale bar, 20 μm. (E–I) Double immunofluorescence staining of HO-1 (green) with cell markers for microglia/macrophages, CD11b; endothelial cells, CD31; neurons, NeuN; astrocytes, GFAP; and neutrophils, myeloperoxidase (MPO), which were visualized by Cy3-conjugated secondary antibodies (red). Arrows point to areas of co-localization. Scale bar, E–I, 30 μm. Inset in H (scale bar: 10 μm) shows a double-stained cell at higher magnification. Sections were obtained 24 h after ICH (n = 3).
Fig. 2
Fig. 2
ICH-induced early brain injury and neurological deficits in wild-type (WT) and HO-1 knockout (HO-1−/−) mice. Age- and weight-matched WT and HO-1−/− male mice were subjected to ICH, and brains were sectioned and stained with luxol fast blue/Cresyl Violet 24 or 72 h after collagenase injection. (A) Representative sections from WT and HO-1−/− mice 24 h after collagenase injection showing different areas of injury as indicated by lack of staining. Scale bar, 100 μm. (B) Quantification shows that brain injury volume was significantly smaller in HO-1−/− mice than in WT mice 24 and 72 h after collagenase injection (n = 10/group, *P<0.05). (C) An investigator blind to genotype assessed the neurological deficits of WT and HO-1−/− mice with a 24-point neurological scoring system at days 1, 2 and 3 after collagenase injection. Neurological deficits were significantly more severe in WT mice than in HO-1−/− mice at day 1. However, the recovery of neurological function was limited in HO-1−/− mice compared with that of WT mice (n = 20/group for day 1, n = 10/group for days 2and 3; **P<0.01). Values are means ± SD.
Fig. 3
Fig. 3
Effect of HO-1 on collagenase-induced bleeding and brain oedema. (A) Total haemoglobin levels were measured in lysates from the injected caudate putamen of mice. A standard curve was made from lysates of control (uninjected) mice. Haemoglobin levels in WT and HO-1−/− mice were not significantly different 5 or 24 h after induction of ICH (n = 10/group, both P>0.05). (B) Twenty-four hours after induction of ICH, brain water content in the ipsilateral basal ganglia of WT and HO-1−/− mice was significantly higher than that of the contralateral basal ganglia. However, no differences in brain water content were observed in ipsilateral basal ganglia, cortex, or cerebellum between WT and HO-1−/− mice (n = 6/group). Cerebel, cerebellum; Cont-BG, contralateral basal ganglia; Cont-CX, contralateral cortex; Ipsi-BG, ipsilateral basal ganglia; Ipsi-CX, ipsilateral cortex. **P<0.01 compared to contralateral side.
Fig. 4
Fig. 4
Effect of HO-1 on leucocyte infiltration after ICH. Infiltrating neutrophils (MPO-positive cells) were apparent in the injury site 5 h post-ICH in WT mice (A), but not in HO-1−/− mice (B). At 24 h post-ICH, many more infiltrating neutrophils were present in and around the injury site in WT mice (C, E) than in HO-1−/− mice (D, F). The images in E and F represent higher magnification of the boxed area in C and D, (G), Quantification analysis indicated that HO-1−/− mice had significantly fewer infiltrating neutrophils than did WT mice at 24 h post-ICH (n = 5/group, **P<0.01). Scale bar, A, B, E, F, 20 μm; C, D, 300 μm.
Fig. 5
Fig. 5
Effect of HO-1 on microglial/macrophage activation after ICH. The distribution and morphology of microglia/macrophages (Iba1-positive) are shown in coronal sections collected at different time-points in WT (A, B, E, F, I, J, M, N) and HO-1−/− (C, D, G, H, K, L, O, P) mice. A–D, Images shown at 0 h are from sham-operated mice. The images in B, F, J, N, D, H, L and P (scale bar: 20 μm) represent higher magnification of the boxed areas in A, E, I, M, C, G, K and O (scale bar: 200 μm), respectively. In sham-operated WT (A, B) and HO-1−/− (C, D) mice, resting microglial cells were sparsely distributed. Insets in B and D (scale bar: 5 μm) illustrate Iba1-positive resting microglial cells at higher magnification. Microglial activation appeared as early as 1 h after ICH in WT (E, F) and HO-1−/− (G, H) mice, but more intensely stained, activated cells (with large cell bodies and short processes) were observed in and around the ICH region in WT mice. This tendency persisted at 5 h (I–L) and up to 24 h (M–P) after ICH. (J) In a WT section 5 h post-ICH, two typical activated microglia/macrophages (elongated, rod cells) are indicated by arrows. (Q) Quantification of activated microglia/macrophages around the border region of injury. HO-1−/− mice had significantly fewer activated microglia/macrophages than WT mice at 5 and 24 h post-ICH (n = 5/group, **P<0.01). Values represent means ± SD.
Fig. 6
Fig. 6
Effect of HO-1 on ROS production after ICH. 8-hydroxyguanosine (8-OHG) was used as a marker for DNA oxidation. (A–H) Sections from WT and HO-1−/− mice were studied at 5 and 24 h post-ICH. The images in B, F, D and H (scale bar: 30 μm) represent higher magnification of the boxed areas in A, E, C and G, respectively (scale bar: 200 μm). 8-OHG-positive cells were detected in and around the injury site at 5 h post-ICH in WT (A, B) and HO-1−/− (C, D) mice. Inset in D (scale bar: 10 μm) illustrates 8-OHG-positive cells at higher magnification. At 24 h post-ICH, 8-OHG-positive neuron-like cells were detected only in the peri-ICH region in WT mice (E, F). Fewer 8-OHG-positive cells were observed in HO-1−/− mice at that time point, and those that were present were most likely to be dying neurons (G, H). (I–N) Double immunofluorescent labeling of 8-OHG with cellular markers for neurons, MAP2; microglia/macrophages, isolectin B4 and astrocytes, GFAP. 8-OHG (red) was visualized by Cy3-conjugated secondary antibody. Cell markers (green) were visualized by Alexa 488-conjugated secondary antibody or by FITC-conjugated isolectin B4. Scale bar, I, K–N, 30 μm; J, 15 μm. (O), Quantification of 8-OHG-positive neuron-like cells around the injury border region. HO-1−/− mice had significantly fewer 8-OHG-positive cells than did WT mice 5 and 24 h after ICH (n = 5/group, ***P<0.001). Values are the means ± SD.

References

    1. Aronowski J, Hall CE. New horizons for primary intracerebral hemorrhage treatment: experience from preclinical studies. Neurol Res. 2005;27:268–79. - PubMed
    1. Balla J, Jacob HS, Balla G, Nath K, Eaton JW, Vercellotti GM. Endothelial-cell heme uptake from heme proteins: induction of sensitization and desensitization to oxidant damage. Proc Natl Acad Sci U S A. 1993;90:9285–9. - PMC - PubMed
    1. Chang EF, Wong RJ, Vreman HJ, Igarashi T, Galo E, Sharp FR, et al. Heme oxygenase-2 protects against lipid peroxidation-mediated cell loss and impaired motor recovery after traumatic brain injury. J Neurosci. 2003;23:3689–96. - PMC - PubMed
    1. Chen K, Gunter K, Maines MD. Neurons overexpressing heme oxygenase-1 resist oxidative stress-mediated cell death. J Neurochem. 2000;75:304–13. - PubMed
    1. Clark W, Gunion-Rinker L, Lessov N, Hazel K. Citicoline treatment for experimental intracerebral hemorrhage in mice. Stroke. 1998;29:2136–40. - PubMed

Publication types

MeSH terms