

Mixture models and exploratory analysis in networks
- PMID: 17525150
- PMCID: PMC1887592
- DOI: 10.1073/pnas.0610537104
Mixture models and exploratory analysis in networks
Abstract
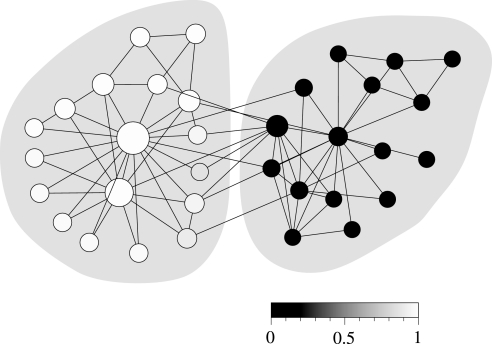
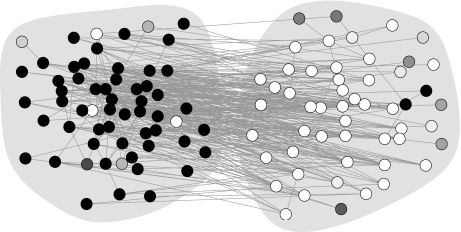
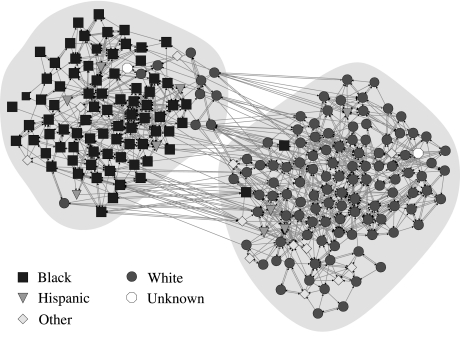
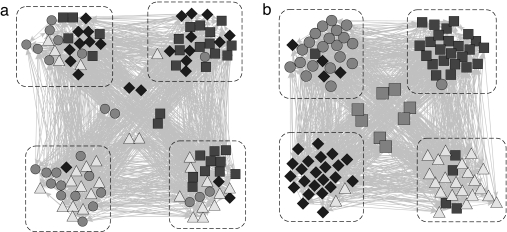
Networks are widely used in the biological, physical, and social sciences as a concise mathematical representation of the topology of systems of interacting components. Understanding the structure of these networks is one of the outstanding challenges in the study of complex systems. Here we describe a general technique for detecting structural features in large-scale network data that works by dividing the nodes of a network into classes such that the members of each class have similar patterns of connection to other nodes. Using the machinery of probabilistic mixture models and the expectation-maximization algorithm, we show that it is possible to detect, without prior knowledge of what we are looking for, a very broad range of types of structure in networks. We give a number of examples demonstrating how the method can be used to shed light on the properties of real-world networks, including social and information networks.
Conflict of interest statement
The authors declare no conflict of interest.
Figures
References
-
- Newman MEJ, Barabási A-L, Watts DJ. The Structure and Dynamics of Networks. Princeton: Princeton Univ Press; 2006.
-
- Albert R, Barabási A-L. Rev Mod Phys. 2002;74:47–97.
-
- Newman MEJ. SIAM Rev. 2003;45:167–256.
-
- Boccaletti S, Latora V, Moreno Y, Chavez M, Hwang D-U. Phys Rep. 2006;424:175–308.
-
- Wasserman S, Faust K. Social Network Analysis. Cambridge, UK: Cambridge Univ Press; 1994.
MeSH terms
Grants and funding
LinkOut - more resources
Full Text Sources
Other Literature Sources
