Clinical Trial
. 2007 Sep 1;110(5):1570-7.
doi: 10.1182/blood-2007-01-070755. Epub 2007 May 24.

ATF2 impairs glucocorticoid receptor-mediated transactivation in human CD8+ T cells

Affiliations
Clinical Trial

ATF2 impairs glucocorticoid receptor-mediated transactivation in human CD8+ T cells

Ling-bo Li et al. Blood. .

Abstract

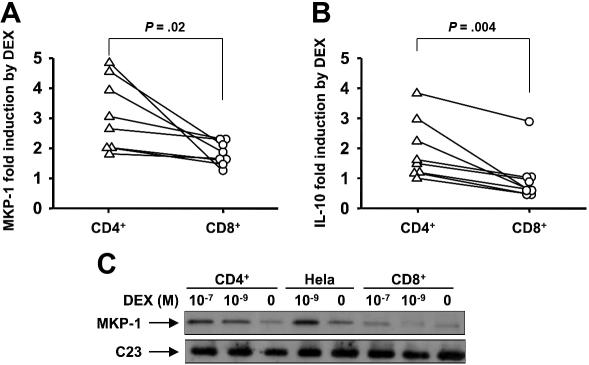
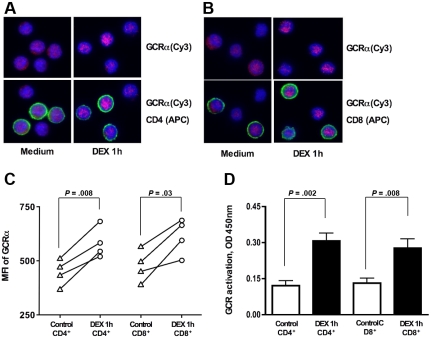
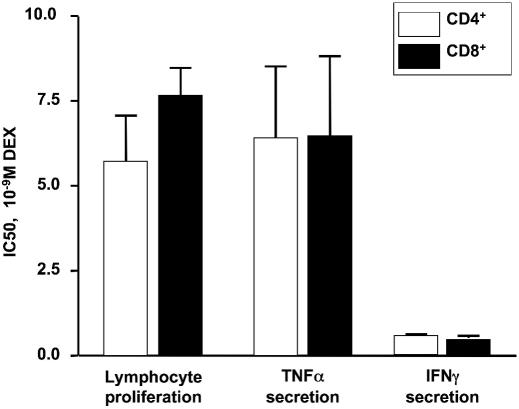
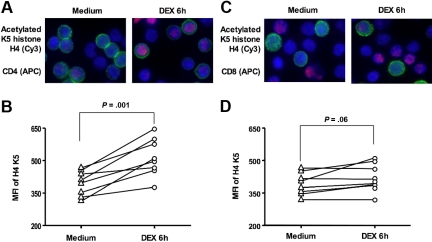
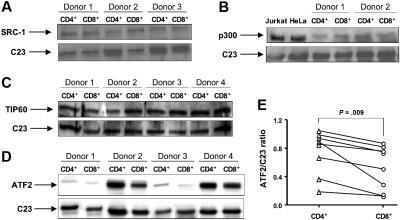
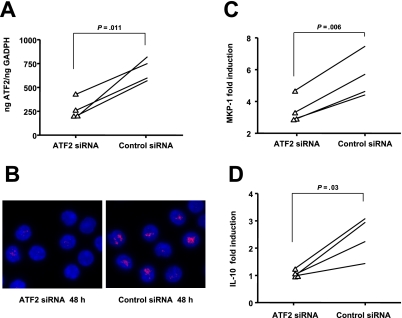
Chronic inflammatory diseases often have residual CD8(+) T-cell infiltration despite treatment with systemic corticosteroids, which suggests divergent steroid responses between CD4(+) and CD8(+) cells. To examine steroid sensitivity, dexamethasone (DEX)-induced histone H4 lysine 5 (K5) acetylation and glucocorticoid receptor alpha (GCR alpha) translocation were evaluated. DEX treatment for 6 hours significantly induced histone H4 K5 acetylation in normal CD4(+) cells (P = .001) but not in CD8(+) cells. DEX responses were functionally impaired in CD8(+) compared with CD4(+) cells when using mitogen-activated protein kinase phosphatase (1 hour; P = .02) and interleukin 10 mRNA (24 hours; P = .004) induction as a readout of steroid-induced transactivation. Normal DEX-induced GCR alpha nuclear translocation and no significant difference in GCR alpha and GCR beta mRNA expression were observed in both T-cell types. In addition, no significant difference in SRC-1, p300, or TIP60 expression was found. However, activating transcription factor-2 (ATF2) expression was significantly lower in CD8(+) compared with CD4(+) cells (P = .009). Importantly, inhibition of ATF2 expression by small interfering RNA in CD4(+) cells resulted in inhibition of DEX-induced transactivation in CD4(+) cells. The data indicate refractory steroid-induced transactivation but similar steroid-induced transrepression of CD8(+) cells compared with CD4(+) cells caused by decreased levels of the histone acetyltransferase ATF2.


Figures

Figure 1
Figure 1
Divergent effects of DEX on anti-inflammatory gene induction in human CD4+ and CD8+ cells. Shown is DEX-induced activation of (A) MKP-1 and (B) IL-10 gene expression by purified human CD4+ and CD8+ cells. MKP-1 and IL-10 mRNA induction by DEX- compared with medium-treated cells were analyzed by real-time PCR. Purified human CD4+ and CD8+ T cells were collected 1 hour after DEX treatment to analyze MKP-1 induction and 24 hours after DEX treatment to analyze IL-10 induction. (C) Differential induction of MKP-1 protein expression by DEX in CD4+ vs CD8+ cells. The cells had been treated by DEX or cultured in medium only for 9 hours. A representative Western blot of 3 independent experiments performed is shown.
Figure 2
Figure 2
GCRα cellular translocation in human CD4+ and CD8+ lymphocytes in response to 10−7 M DEX treatment in vitro. Freshly isolated PBMCs were stimulated for 1 hour with 10−7 M DEX or remained untreated. Representative images of GCRα cellular translocation in (A) CD4+ and (B) CD8+ T cells in response to DEX treatment are shown (original magnification × 630; blue, DAPI, nuclear staining; red, cy3, GCRα; green, APC, CD4+ or CD8+ T-cell surface staining) (the cells from 4 different donors were evaluated in this assay). Note cytoplasmic localization of GCRα before DEX treatment and increase in nuclear localization of the GCRα after DEX treatment in both CD4+ and CD8+ T cells. See “Materials and methods, GCRα nuclear translocation” for more detailed image acquisition information. (C) GCRα (Cy3) MFI for the nuclear region of CD4+ and CD8+ before and after DEX treatment. (D) Addition of DEX resulted in significant increase in the amount of nuclear GCR in both purified CD4+ and CD8+ cells. GCR was measured in nuclear extracts from CD4+ vs CD8+ T cells plus or minus DEX (1 hour) on the basis of its interaction with GRE consensus motive immobilized to the plate (TransAM GR transcription factor assay). Data are expressed as mean plus or minus SEM (n = 6).
Figure 3
Figure 3
DEX IC50 required for inhibition of anti-CD3–stimulated proliferation and cytokine secretion by purified human CD4+ and CD8+ T cells from normal donors. No significant difference was observed between CD4+ and CD8+ T cells. Data are expressed as mean plus or minus SEM (n = 3).
Figure 4
Figure 4
DEX-induced histone H4 K5 acetylation in human CD4+ and CD8+ T cells. Representative images of acetylated histone H4 K5 in CD4+ and CD8+ cells in response to 6 hours of 10−7 M DEX treatment in vitro are shown (original magnification × 630; blue, DAPI, nuclear staining; red, cy3, acetylated histone H4 K5; green, APC, surface staining with (A) anti-CD4 or (C) anti-CD8 APC antibodies). The MFI of cy3 staining (acetylated histone H4 K5) in CD4+ (B) and CD8+ (D) cells was assessed by analysis software within the computer-generated masks for the cell nuclei. Cells (50–100) were analyzed for each donor studied (n = 8). See “Materials and methods, GCRα nuclear translocation” for more detailed image acquisition information.
Figure 5
Figure 5
The expression of HATs SRC-1, p300, TIP60, and ATF2 in normal CD4+ and CD8+ lymphocytes. Nuclear or whole-cell proteins were extracted from purified CD4+ and CD8+ T cells. The expression of (A) SRC-1, (B) p300, (C) TIP60, and (D) ATF2 was evaluated by Western blot. C23 was used as a loading control for nuclear proteins. Nuclear extracts from Jurkat T cells and HeLa cells were used as positive controls for the anti-p300 antibody. Vertical lines have been inserted to indicate where a gel lane was cut. These gels came from 2 different experiments. (E) The ratio of AFT2 to C23 was calculated as a ratio of density for AFT2 and C23 bands measured with National Institutes of Health (Bethesda, MD) Image 1.63 software.
Figure 6
Figure 6
Inhibition of ATF2 gene expression using specific siRNA in human CD4+ decreases the transactivation activity of steroids. Introduction of ATF2 siRNA into CD4+ T cells resulted in specific inhibition of ATF2 expression as shown by (A) real-time PCR and (B) immunostaining (original magnification ×630; blue, DAPI, nuclear staining; red, cy3, ATF2; see “Materials and methods, GCRα nuclear translocation” for more detailed image acquisition information). The pictures are representatives of 4 independent experiments. Silencing of ATF2 resulted in a significant decrease of DEX-induced (C) MKP-1 and (D) IL-10 production by human CD4+ T cells (n = 4) compared with a nonspecific siRNA control group.

References

    1. Leung DY, Bloom JW. Update on glucocorticoid action and resistance. J Allergy Clin Immunol. 2003;111:3–22. - PubMed
    1. Rhen T, Cidlowski JA. Antiinflammatory action of glucocorticoids: new mechanisms for old drugs. N Engl J Med. 2005;353:1711–1723. - PubMed
    1. Chrousos GP, Kino T. Intracellular glucocorticoid signaling: a formerly simple system turns stochastic. Sci STKE. 2005;2005:pe48. - PubMed
    1. Duma D, Jewell CM, Cidlowski JA. Multiple glucocorticoid receptor isoforms and mechanisms of post-translational modification. J Steroid Biochem Mol Biol. 2006;102:11–21. - PubMed
    1. Koike M, Sekigawa I, Okada M, et al. Relationship between CD4(+)/CD8(+) T cell ratio and T cell activation in multiple myeloma: reference to IL-16. Leuk Res. 2002;26:705–711. - PubMed

Publication types

MeSH terms

Substances