. 2007 Jun;16(6):1101-18.
doi: 10.1110/ps.062323407.

Molecular dynamics simulations of the native and partially folded states of ubiquitin: influence of methanol cosolvent, pH, and temperature on the protein structure and dynamics

Affiliations

Molecular dynamics simulations of the native and partially folded states of ubiquitin: influence of methanol cosolvent, pH, and temperature on the protein structure and dynamics

David B Kony et al. Protein Sci. 2007 Jun.

Abstract

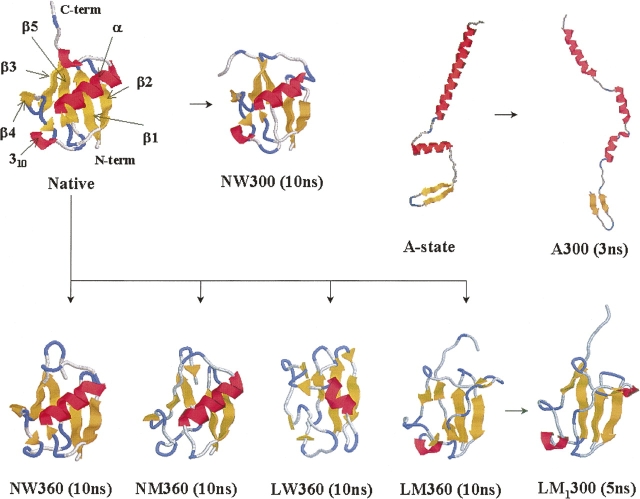
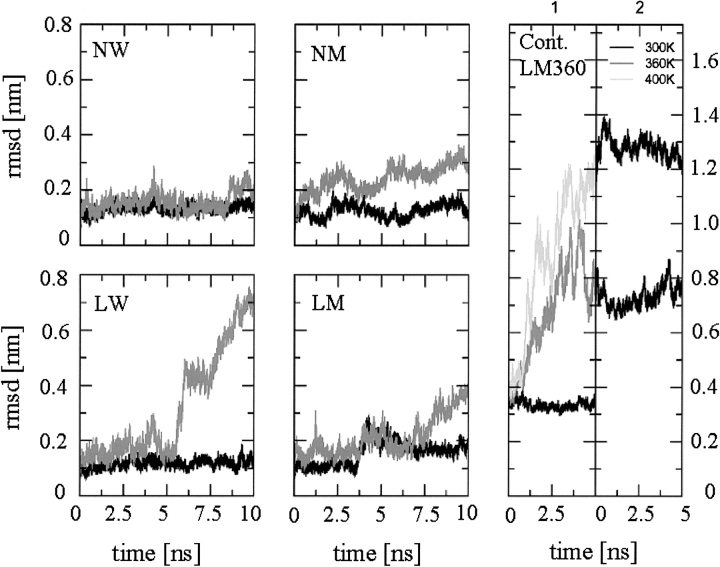
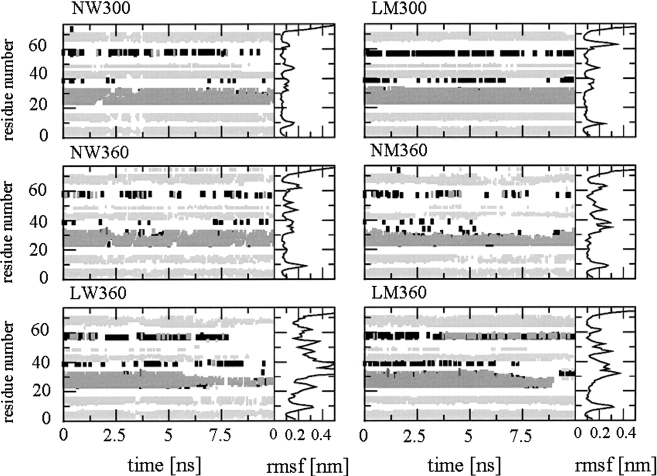
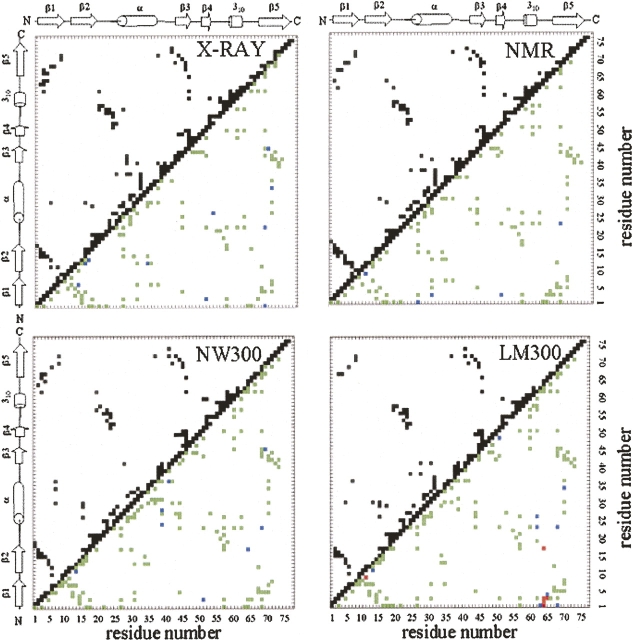
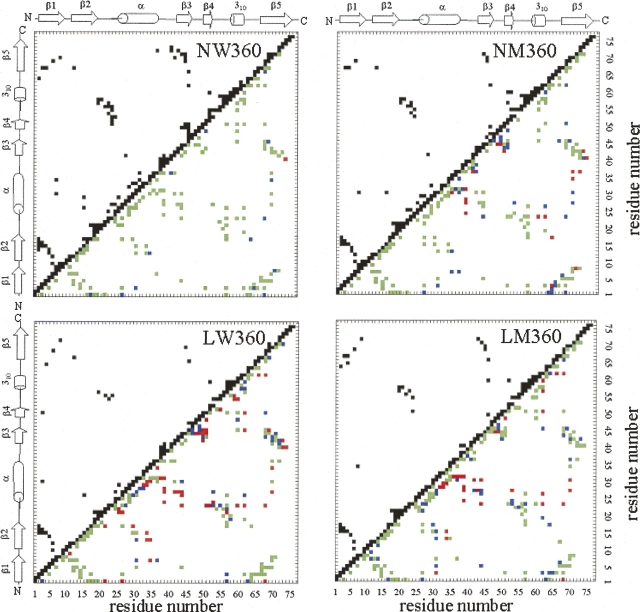
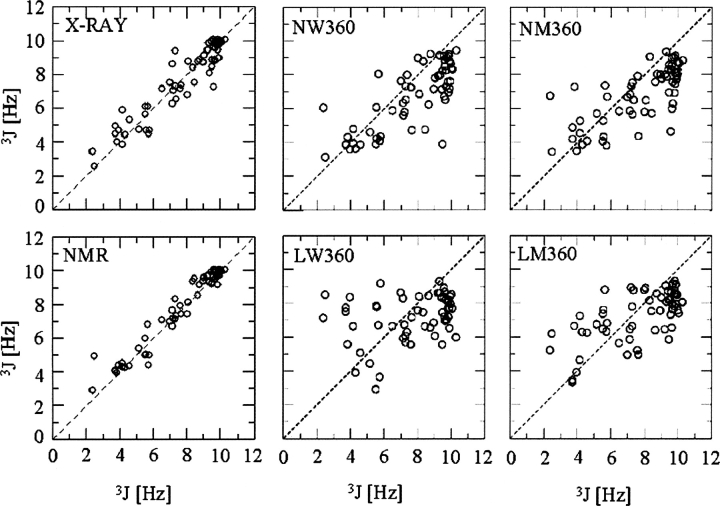
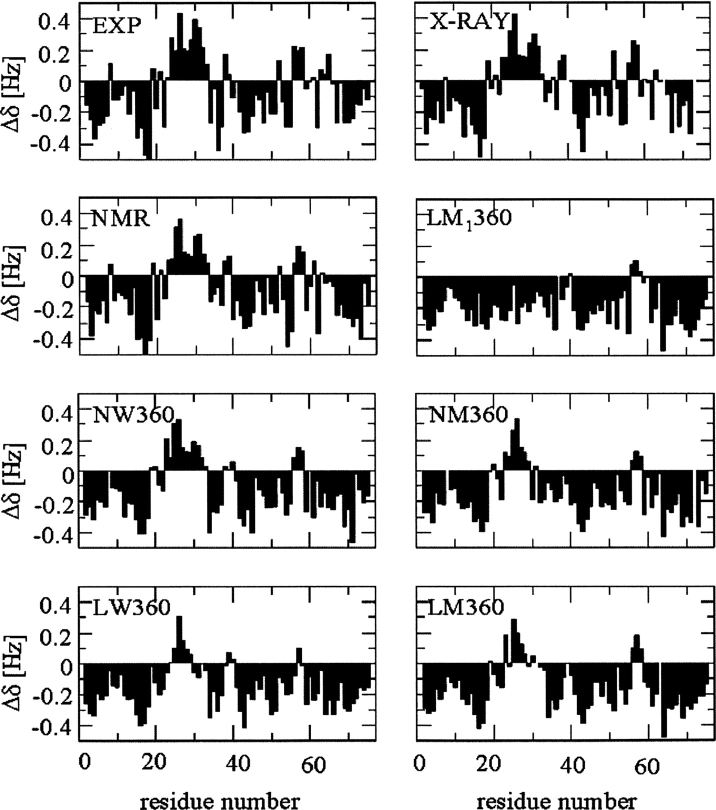
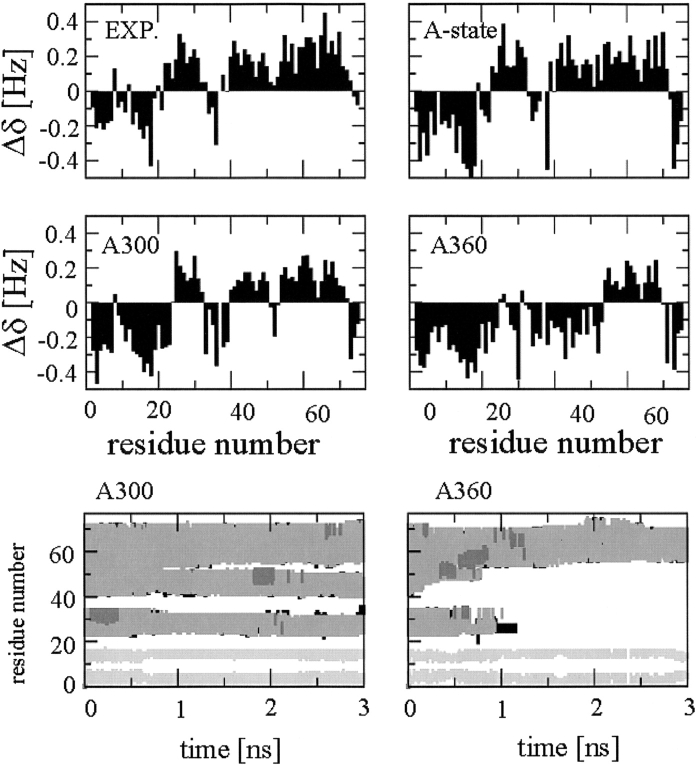
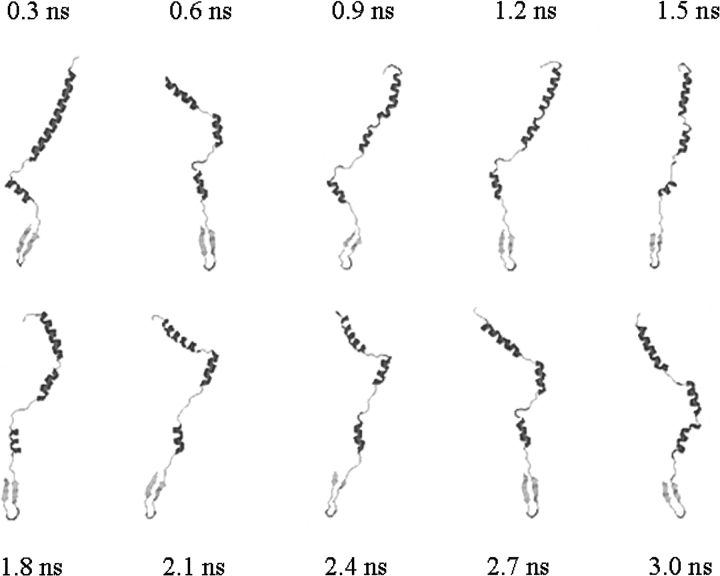
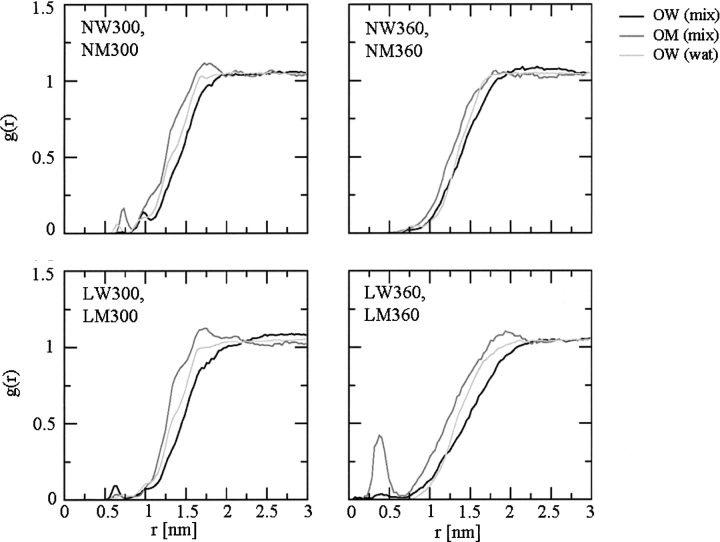
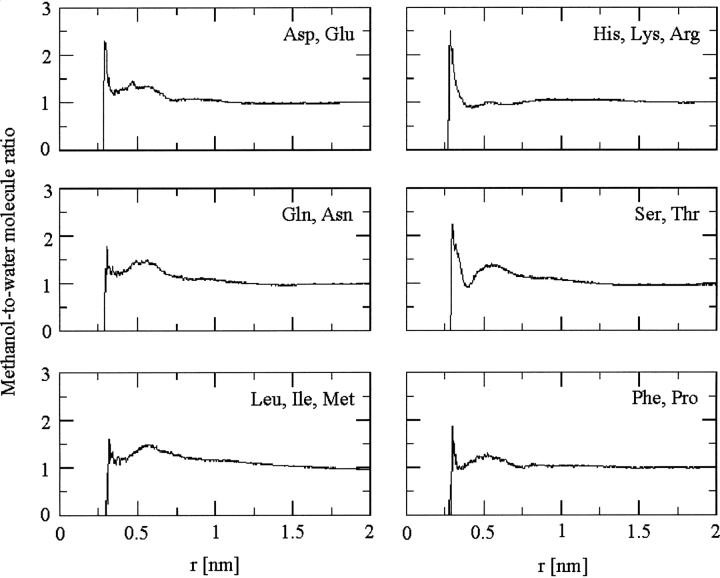
A series of explicit-solvent molecular dynamics simulations of the protein ubiquitin are reported, which investigate the effect of environmental factors (presence of methanol cosolvent in the aqueous solution, neutral or low pH value, room or elevated temperature) on the structure, stability, and dynamics of the protein. The simulations are initiated either from the native structure of the protein or from a model of a partially folded state (A-state) that is known to exist at low pH in methanol-water mixtures. The main results of the simulations are: (1) The ubiquitin native structure is remarkably stable at neutral pH in water; (2) the addition of the methanol cosolvent enhances the stability of the secondary structure but weakens tertiary interactions within the protein; (3) this influence of methanol on the protein structure is enhanced at low pH, while the effect of lowering the pH in pure water is limited; and (4) the A-state of ubiquitin can be described as a set of relatively rigid secondary structure elements (a native-like beta-sheet and native-like alpha-helix plus two nonnative alpha-helices) connected by flexible linkers.


Figures

Figure 1.
Figure 1.
Ribbon diagrams of ubiquitin highlighting the secondary-structure content of the native structure (Vijay-Kumar et al. 1987), the modeled A-state, and the final structures corresponding to selected simulations (see Table 1 and Fig. 2). The structure assumed representative of the A-state (built based on the schematic model proposed by Brutscher et al. 1997; see Fig. 1 therein) and the corresponding structure after 3 ns of MD simulation should be taken with some caution. Owing to the limited amount of experimental data involved in the building of the model (underdetermination), the enhanced segmental mobility in this state (compared to the native one) and the short timescale of the simulation (3 ns), these structures probably represent illustrative conformations in the corresponding conformational ensemble rather than accurate structural models.
Figure 2.
Figure 2.
Durations and temperatures of the continuation runs branched from simulation LM360 (see Table 1). The code LM indicates simulations performed at low pH and in a 60% methanol–water mixture. In a first set of continuation runs (subscript 1), three simulations (LM1300, LM1360, and LM1400) are performed during 5 ns using the final configuration of LM360 as a starting structure, and temperatures of 300 K, 360 K, and 400 K, respectively. In a subsequent set (subscript 2), two simulations [LM2300(360) and LM2300(400)] are performed during 5 ns using the final configurations of LM1360 and LM1400, respectively, as starting structures, and a temperature of 300 K.
Figure 3.
Figure 3.
Cα root-mean-square atomic positional deviation (RMSD) from the crystallographic structure (Vijay-Kumar et al. 1987), displayed as a function of time for the different ubiquitin simulations listed in Table 1 (omitting simulations A300 and A360; four left panels) and Figure 2 (continuations of LM360; right panel).
Figure 4.
Figure 4.
Secondary-structure content as a function of time (horizontal graphs) and Cα root-mean-square atomic positional fluctuations (RMSF) as a function of the residue sequence number (vertical graphs) corresponding to selected ubiquitin simulations (Table 1). The secondary-structure assignment is performed according to the criteria proposed by Kabsch and Sander (1983): (black) 310-helix, (dark gray) α-helix, and (light gray) β-strand. Regions corresponding to β-bridges, turns, bends, or undefined structure are not displayed. The RMSF values are calculated over the entire 10-ns simulations.
Figure 5.
Figure 5.
Average violations of the calculated interproton distances with respect to the corresponding experimentally derived (NOE) upper bounds as a function of the residue sequence number, for the crystallographic (X-ray) structure (Vijay-Kumar et al. 1987), the set of 10 NMR model structures (Cornilescu et al. 1998), and the simulations NW300 and LM300 (see Table 1). The differences are calculated based on r−3-averaging over the structures or trajectory configurations (last 2 ns), whereby only positive values are considered as violations, and the possible violations are averaged over all proton pairs belonging to a given residue pair. The black squares in the upper-left triangles indicate residue pairs involving one or more experimental NOE-derived distance bounds, none of them being violated. The squares in the bottom-right triangles indicate residue pairs with positive average violations of (green) 0.0–0.2 nm, (blue) 0.2–0.4 nm, and (red) >0.4 nm. The secondary-structure elements present in the native state of ubiquitin are indicated along with the residue numbers on each axis. Note that the number of squares of a given kind is not directly comparable to the data in Table 2 (given on a per-proton-pair basis) because of averaging over the residues.
Figure 6.
Figure 6.
Average violations of the calculated interproton distances with respect to the experimentally derived (NOE) upper bounds as a function of the residue sequence number, for the simulations NW360, NM360, LW360, and LM360 (see Table 1). See the legend for Figure 5.
Figure 7.
Figure 7.
Comparison between experimental (horizontal axis) and calculated (vertical axis) amide to Cα protons’ 3 J-coupling constants for the X-ray structure (Vijay-Kumar et al. 1987), the set of 10 NMR model structures (Cornilescu et al. 1998), and the simulations NW360, NM360, LW360, and LM360 (see Table 1). The calculations were performed using the Karplus relationship of Equation 1 (Wang and Bax 1996), based on the last 2 ns of the simulations. The experimental data are taken from Wang and Bax (1996).
Figure 8.
Figure 8.
Cα secondary chemical shifts (Δδ) from experiment (303 K, at pH 5.7, in water) (Wand et al. 1996), and calculated for the X-ray structure (Vijay-Kumar et al. 1987), the set of 10 NMR model structures (Cornilescu et al. 1998), and the simulations NW360, NM360, LM360, LW360, and LM1360 (see Table 1; Fig. 2). The calculations were performed using the SHIFTS program (Xu and Case 2001), based on the last 2 ns of the simulations. The residue-type-specific random-coil chemical shifts in water were taken from Richarz and Wuethrich (1978) (without correction for the methanol–water environment).
Figure 9.
Figure 9.
Cα secondary chemical shifts (Δδ) (four top panels) from experiment (300 K, at pH 2 in a 60% methanol–water mixture) (Brutscher et al. 1997) and calculated for the model A-state and the simulations A300 and A360 (see Table 1), and secondary-structure content as a function of time (two bottom panels) for the two latter simulations. See the legends for Figures 4 and 8.
Figure 10.
Figure 10.
Ribbon diagrams of ubiquitin highlighting the secondary-structure content as a function of time for the simulation A300 (see Table 1). Snapshots are taken at successive 0.3-ns intervals.
Figure 11.
Figure 11.
Radial distribution functions g(r) for the water (OW) and methanol oxygen (OM) atoms shown as a function of the distance r from the center of geometry of the protein for the simulations NW300, NW360, NM300, NM360, LW300, LW360, LM300, and LM360 (see Table 1). Averaging is performed over the last 2 ns of the simulations.
Figure 12.
Figure 12.
Distributions of the methanol-to-water molecule ratio (normalized to the bulk values) around side chains of different types for the simulation A300 (see Table 1). Side-chain types are sorted as follows: acidic (Asp Cβ, Glu Cγ; neutral, polar), basic (His Cγ, Lys Cɛ, Arg Cδ; positively charged), amide (Gln Cγ, Asn Cβ; polar), alcohol (Ser Cβ, Thr Cβ; polar), aliphatic (Leu Cγ, Ile Cγ, Met Cγ; nonpolar), and aromatic and heterocyclic (Phe Cγ, Pro Cγ; nonpolar). Averaging is performed over the last 2 ns of the simulations.

Similar articles

Cited by

References

    1. Alexandrescu A.T., Ng, Y.L., and Dobson, C.M. 1994. Characterization of a trifluoroethanol-induced partially folded state of α-lactalbumin. J. Mol. Biol. 235: 587–599. - PubMed
    1. Alonso D.O. and Daggett, V. 1995. Molecular dynamics simulations of protein unfolding and limited refolding: Characterization of partially unfolded states of ubiquitin in 60% methanol and in water. J. Mol. Biol. 247: 501–520. - PubMed
    1. Arai M. and Kuwajima, K. 2000. Role of the molten globule state in protein folding. Adv. Protein Chem. 53: 209–282. - PubMed
    1. Barker J.A. and Watts, R.O. 1973. Monte-Carlo studies of the dielectric properties of water-like models. Mol. Phys. 26: 789–792.
    1. Berendsen H.J.C., Postma, J.P.M., van Gunsteren, W.F., and Hermans, J. 1981. Interaction models for water in relation to protein hydration. Jerusalem Symposia on Quantum Chemistry and Biochemistry, Vol. 14, pp. 331–342. Reidel, Dordrecht, Holland.

Publication types