. 2007 Jun;117(6):1658-69.
doi: 10.1172/JCI31561. Epub 2007 May 24.

Macrophage PPAR gamma is required for normal skeletal muscle and hepatic insulin sensitivity and full antidiabetic effects of thiazolidinediones

Affiliations

Macrophage PPAR gamma is required for normal skeletal muscle and hepatic insulin sensitivity and full antidiabetic effects of thiazolidinediones

Andrea L Hevener et al. J Clin Invest. 2007 Jun.

Abstract

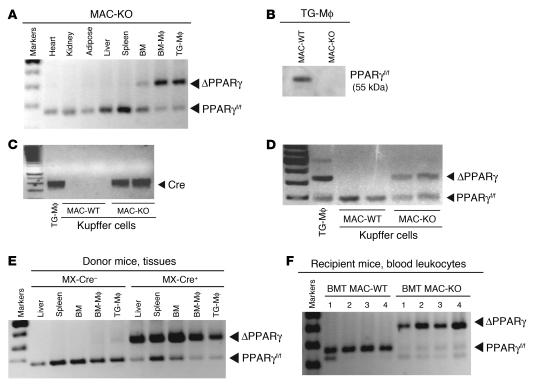
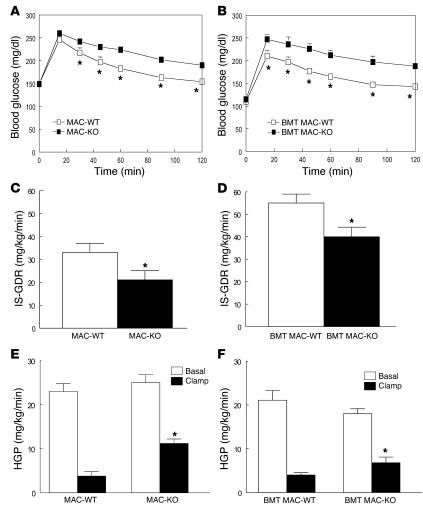
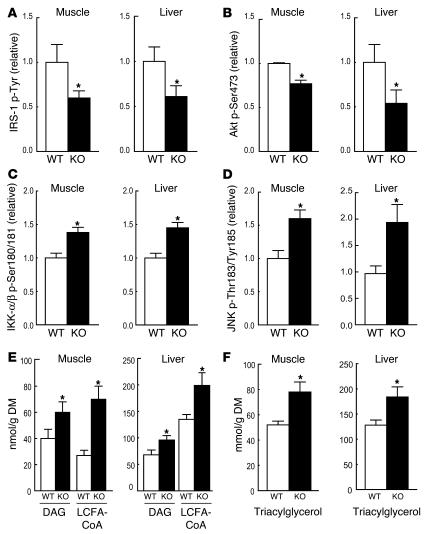
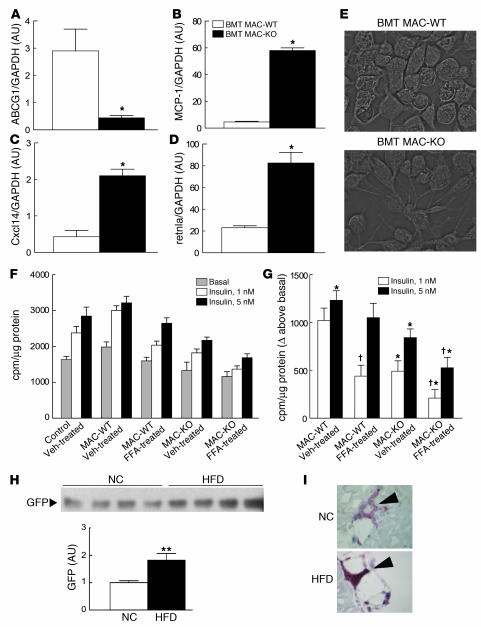
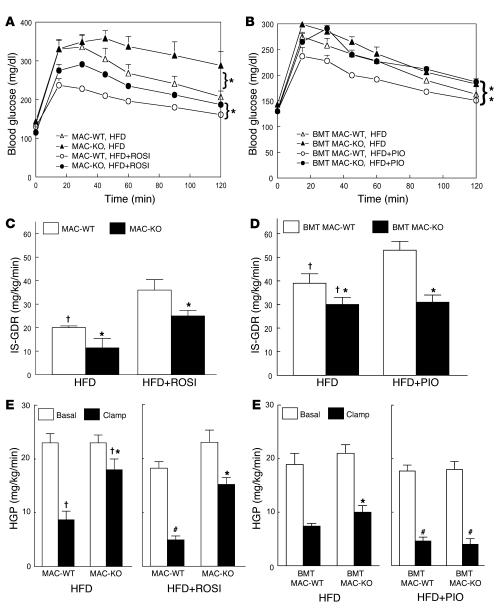
PPAR gamma is required for fat cell development and is the molecular target of antidiabetic thiazolidinediones (TZDs), which exert insulin-sensitizing effects in adipose tissue, skeletal muscle, and liver. Unexpectedly, we found that inactivation of PPAR gamma in macrophages results in the development of significant glucose intolerance plus skeletal muscle and hepatic insulin resistance in lean mice fed a normal diet. This phenotype was associated with increased expression of inflammatory markers and impaired insulin signaling in adipose tissue, muscle, and liver. PPAR gamma-deficient macrophages secreted elevated levels of factors that impair insulin responsiveness in muscle cells in a manner that was enhanced by exposure to FFAs. Consistent with this, the relative degree of insulin resistance became more severe in mice lacking macrophage PPAR gamma following high-fat feeding, and these mice were only partially responsive to TZD treatment. These findings reveal an essential role of PPAR gamma in macrophages for the maintenance of whole-body insulin action and in mediating the antidiabetic actions of TZDs.


Figures

Figure 1
Figure 1. Efficiency of LysCre- and MXCre-mediated loxP recombination in peritoneal macrophages, BM-derived macrophages, and hepatic Kupffer cells.
(A) PCR analysis of genomic DNA isolated from the indicated tissues, BM, BM-Mφ, and TG-Mφ of conditionally targeted LysMCre+PPARγf/f (MAC-KO) mice. (B) Western blot analysis of protein isolated from peritoneal macrophages harvested from MAC-WT and MAC-KO mice. (C and D) PCR analysis of genomic DNA from purified Kupffer cells harvested from MAC-WT and MAC-KO mice. (E) PCR analysis of genomic DNA isolated from hematopoietic tissues (liver, spleen, BM, BM-Mφ, and TG-Mφ) from MXCrePPARγf/f control and conditionally targeted MXCre+PPARγf/f donor mice after poly-I:C induction. (F) PCR analysis of genomic DNA isolated from circulating blood leukocytes from BMT MAC-WT and BMT MAC-KO mice 4–6 weeks after BMT.
Figure 2
Figure 2. Macrophage-specific PPARγ gene deletion causes glucose intolerance and skeletal muscle and hepatic insulin resistance.
GTTs were performed following a 6-hour fast in 12-month-old MAC-WT (n = 6) versus MAC-KO (n = 7) (A) and 10-month-old BMT MAC-WT (n = 7) versus BMT MAC-KO (n = 10) mice (B). *P < 0.05, mean values for WT (open squares) versus KO (filled squares); repeated-measures ANOVA with Tukey’s post-hoc procedure. Insulin’s ability to stimulate glucose disposal (IS-GDR) into skeletal muscle of 12-month-old MAC-WT (n = 6) versus MAC-KO (n = 7) (C) and 10-month-old BMT MAC-WT (n = 7) versus BMT MAC-KO (n = 10) mice (D). IS-GDR values are expressed as mean ± SEM. Mean differences were detected using 1-way ANOVA. *P < 0.05 between genotypes. Insulin’s ability to suppress HGP was determined in MAC-WT versus MAC-KO (E) and BMT MAC-WT versus BMT MAC-KO (F) mice. HGP values are expressed as mean ± SEM for basal conditions versus clamp. Mean differences between genotypes within condition were detected using 1-way ANOVA. *P < 0.05 between genotypes, within condition.
Figure 3
Figure 3. Macrophage-specific PPARγ gene deletion causes impaired insulin signaling and lipid accumulation in skeletal muscle and liver.
Skeletal muscle (quadriceps) and liver samples were harvested from BMT MAC-WT (n = 6; white bars) and BMT MAC-KO (n = 6; black bars) mice following the glucose clamp, and homogenates were immunoprecipitated and immunoblotted for the quantification of IRS-1 tyrosine phosphorylation (A) as well as for Akt1/2 (Ser473), (C) IKK-α/β (Ser180/181), and (D) JNK (Thr183/Tyr185) phosphorylation relative to protein content (B). Muscle and liver samples were also dehydrated and analyzed for the accumulation of lipid intermediates including diacylglycerol (DAG), long-chain fatty acyl-CoA (LCFACoA) (E), and triacylglycerol (F). All values are expressed as a mean ± SEM. Mean differences were detected using 1-way ANOVA; *P < 0.05.
Figure 4
Figure 4. Enriched PPARγ motif in promoters of downregulated genes.
Computational motif discovery identified a motif with a significant match to the known PPARγ consensus recognition element in promoters of genes downregulated in macrophages from BMT MAC-KO compared with BMT MAC-WT.
Figure 5
Figure 5. Loss of PPARγ causes macrophage activation and secretion of insulin resistance producing molecules.
Altered expression of ABCG1 (A), MCP-1 (B), Cxcl14 (C), and retnla (D) in TG-Mφ from NC-fed BMT MAC-KO (n = 9; black bars) versus BMT MAC-WT (n = 9; white bars) mice. (E) TG-Mφ showing advanced stress fiber formation in the BMT MAC-KOs (NC-fed). Impaired insulin-stimulated 2-deoxyglucose uptake into L6 myocytes incubated with CM from vehicle- (Veh-) or FFA-treated TG-Mφ harvested from BMT MAC-KO (n = 6) versus BMT MAC-WT (n = 6) mice (F and G) and increased GFP-labeled BM-derived cells in skeletal muscle from mice fed a HFD (black bar) versus NC (white bar) (H). Values for RT-PCR are expressed as mean ± SEM. *P < 0.05 between genotypes. Insulin-stimulated 2-DOG assays represent 6 wells per condition and are expressed as mean ± SEM in cpm/μg of protein for absolute tracer uptake values (F) and uptake expressed above basal (G). *P < 0.05, BMT MAC-WT versus BMT MAC-KO, within incubation condition; P < 0.05, vehicle versus FFA, within genotype. (H) GFP immunoblots were quantified using densitometric analysis, and mean expression values ± SEM are presented. n = 4 per group. **P < 0.05 between dietary groups. (I) Immunohistochemical detection shows increased CD11c- and F4/80-expressing cells in skeletal muscle following 8 weeks of high-fat feeding.
Figure 6
Figure 6. Macrophage-specific PPARγ deletion causes susceptibility to HFD-induced insulin resistance and diminished TZD effectiveness.
GTTs were performed on 12-month-old male MAC-KO versus MAC-WT mice fed a HFD with or without rosiglitazone (ROSI) (A) and 10-month-old male BMT MAC-WT versus BMT MAC-KO mice fed a HFD with or without pioglitazone (PIO) (B) for 8 weeks. Mean blood glucose concentrations ± SEM are shown for both groups of WT mice fed a HFD (open triangles) or HFD plus TZD (open circles) and for both groups of KO mice fed a HFD (filled triangles) or HFD plus TZD (filled circles). *P < 0.05; statistical differences were determined using repeated-measures ANOVA. (C and D) IS-GDR was determined in both groups of HFD-fed TZD-treated and untreated WT (MAC-WT and BMT MAC-WT; white bars) and KO (MAC-KO and BMT MAC-KO; black bars) mice. HGP at basal conditions (white bars) and during insulin stimulation (black bars) was determined for MAC-WT and MAC-KO (E) and for BMT MAC-WT and BMT MAC-KO (F) mice. Values are expressed as mean ± SEM (n = 5–7 mice/group). Significant differences were detected using 1-way ANOVA. P < 0.05, NC (Figure 2, C–F) versus HFD, within genotype; *P < 0.05 between genotypes within diet and condition; #P < 0.05, HFD versus HFD plus TZD, within genotype and condition.

References

    1. DeFronzo R.A., Bonadonna R.C., Ferrannini E. Pathogenesis of NIDDM. A balanced overview. Diabetes Care. 1992;15:318–368. - PubMed
    1. Reaven G.M. Role of insulin resistance in human disease (syndrome X): an expanded definition. Annu. Rev. Med. 1993;44:121–131. - PubMed
    1. Miranda P.J., DeFronzo R.A., Califf R.M., Guyton J.R. Metabolic syndrome: definition, pathophysiology, and mechanisms. Am. Heart J. 2005;149:33–45. - PubMed
    1. Arkan M.C., et al. IKK-β links inflammation to obesity-induced insulin resistance. Nat. Med. 2005;11:191–198. - PubMed
    1. Cai D., et al. Local and systemic insulin resistance due to hepatic activation of IKK-β and NF-κB. Nat. Med. 2005;11:183–190. - PMC - PubMed

Publication types

MeSH terms