. 2007 Jun;117(6):1670-8.
doi: 10.1172/JCI30440. Epub 2007 May 24.

Hypothalamic resistin induces hepatic insulin resistance

Affiliations

Hypothalamic resistin induces hepatic insulin resistance

Evan D Muse et al. J Clin Invest. 2007 Jun.

Abstract

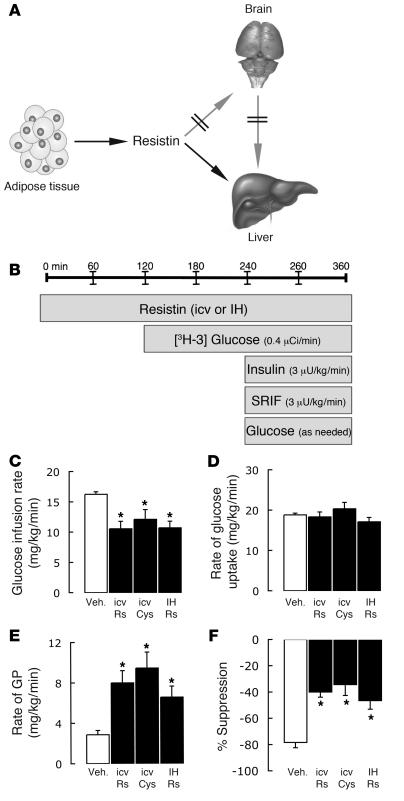
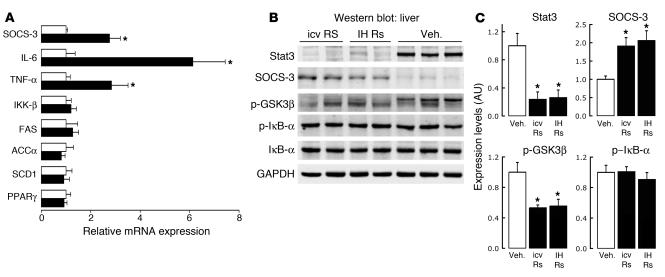
Circulating resistin stimulates endogenous glucose production (GP). Here, we report that bi-directional changes in hypothalamic resistin action have dramatic effects on GP and proinflammatory cytokine expression in the liver. The infusion of either resistin or an active cysteine mutant in the third cerebral ventricle (icv) or in the mediobasal hypothalamus stimulated GP independent of changes in circulating levels of glucoregulatory hormones. Conversely, central antagonism of resistin action markedly diminished the ability of circulating resistin to enhance GP. We also report that centrally mediated mechanisms partially control resistin-induced expression of TNF-alpha, IL-6, and SOCS-3 in the liver. These results unveil what we believe to be a novel site of action of resistin on GP and inflammation and suggest that hypothalamic resistin action can contribute to hyperglycemia in type 2 diabetes mellitus.


Figures

Figure 1
Figure 1. Central administration of recombinant resistin induces hepatic insulin resistance in rats.
(A) Mechanisms of resistin action on hepatic GP. Increased circulating levels of resistin lead to impaired hepatic insulin action, though whether this is mediated in part via pathways initiated in the hypothalamus is unknown. Here we investigate this “indirect” pathway; arrows interrupted by double bars indicate our attempt to block pathway using Rs Ab. (B) Experimental design for hyperinsulinemic-euglycemic clamp studies. Resistin infusion studies lasted 360 minutes. Recombinant mouse resistin or aCSF was infused into Sprague-Dawley rats via icv (300 ng total; 8 ng/μl at 5 μl/h) or IH (16 ng total; 8 ng/μl at 0.33 μl/h) cannulae. At 120 minutes, rats received a primed-constant infusion of [3H-3]glucose (0.4 μCi/min). Hyperinsulinemic-euglycemic pancreatic/insulin clamp was initiated at 240 minutes, with a constant infusion of insulin (3 mU/kg/min) and somatostatin (3 μg/kg/min); infusion of 10% glucose solution was periodically adjusted to maintain steady plasma glucose concentration. SRIF, somatostatin. (C) Glucose infusion rates necessary to maintain euglycemia in the presence of hyperinsulinemia (3 mU/kg/min) were significantly lower in resistin-treated groups compared with vehicle. (D) Rates of glucose uptake were unaffected by central infusion of resistin. (E) Rates of endogenous GP for resistin-infused animals were nearly 2-fold greater than those of vehicle. (F) Percentage suppression of endogenous GP induced by insulin infusion (3 mU/kg/min), a clear readout of whole-body insulin sensitivity, was reduced 50% in resistin-treated groups compared with vehicle. *P < 0.05 compared with vehicle (Veh.).
Figure 2
Figure 2. Central resistin increased hepatic glucoses fluxes predominantly via glycogenolytic pathways.
(A and B) icv or IH infusion of resistin (black bars) resulted in 2- to 3-fold increases in hepatic flux through G6Pase (A) and glucose cycling (B) compared with vehicle (white bars). (C and D) Increased hepatic glucose fluxes were mainly accounted for by an increased rate of glycogenolysis (D) rather than gluconeogenesis (C). (E) Quantitative real-time RT-PCR revealed that central resistin had no effect on the hepatic expression of the key gluconeogenic enzymes PEPCK and G6Pase. (F) Decreased levels of p-AMPKα were apparent in the livers of resistin-treated animals as analyzed by immunoblot. *P < 0.05 compared with vehicle.
Figure 3
Figure 3. Real-time RT-PCR and Western immunoblot analysis of hepatic inflammation and insulin signaling.
(A) icv resistin administration (black bars) increased hepatic gene expression of proinflammatory mediators SOCS-3, IL-6, and TNF-α compared with vehicle-treated animals (white bars) but had no change on IKK-β, FAS, ACC1, SCD1, and PPARγ. (B and C) Significant decreases in total Stat3 protein and p-GSK3β were detected in the livers following central resistin administration (black bars), with a reciprocal but converse elevation in SOCS-3 when compared with controls (white bars). The levels of p–IκB-α remained unchanged (C). *P < 0.05 compared with vehicle.
Figure 4
Figure 4. The effects of increased levels of circulating plasma resistin are attenuated in animals treated with IH anti-resistin antibodies.
(A) Experimental design for hyperinsulinemic-euglycemic clamp studies. IH infusion of Con Ab or Rs Ab (0.33 μl bolus followed 0.5 μl/h infusion) was initiated at 0 minutes and continued throughout the 360-minute course of study. Resistin (30 μg total dose) was infused i.v. at a constant rate starting at 60 minutes. The remainder of the study was completed as described in Figure 1. (B) Rates of glucose uptake during the insulin clamp studies were unaffected in all groups. (C) The rate of endogenous GP for i.v. resistin–infused animals also receiving an IH infusion of Con Ab was greatly increased compared with controls but was attenuated in animals receiving the IH infusion of Rs Ab. (D) Changes in the percentage suppression of endogenous GP in animals receiving i.v. resistin and IH Ab infusions. *P < 0.05 compared with vehicle; #P < 0.05 compared with Con Ab.
Figure 5
Figure 5. Central blockade of resistin after peripheral (i.v.) resistin infusion attenuates increases in hepatic glucose fluxes.
(A and B) IH administration of Rs Ab decreased hepatic flux through G6Pase (A) and glucose cycling (B) in animals receiving a constant i.v. infusion of resistin, compared with animals receiving Con Ab, although it failed to completely normalize these to vehicle-treated levels. (C and D) Alterations of hepatic glucose fluxes in these animals were mirrored by concomitant changes in glycogenolysis (D) but not gluconeogenesis (C). (E) Peripheral (i.v.) infusion of resistin increased the hepatic expression of G6Pase message levels, which were not attenuated by central Rs Ab administration as assayed by real-time RT-PCR. Parallel changes in PEPCK expression levels were absent. (F) Depressed levels of p-AMPKα and subsequent, albeit minor, attenuation of this effect by central Rs Ab were apparent in the livers of i.v. resistin–treated animals compared with vehicle as analyzed by immunoblot. *P < 0.05 compared with vehicle; #P < 0.05 compared with Con Ab.
Figure 6
Figure 6. The increased expression of inflammatory genes in the liver following peripheral (i.v.) resistin infusion is ameliorated by central Rs Ab.
(A) The increase in hepatic gene expression of key inflammatory mediators TNF-α and IL-6 in animals receiving a peripheral resistin infusion (30 μg total over 5 h) with central (IH) Con Ab (black bar) compared with vehicle-infused animals (white bars) was attenuated in animals receiving the same peripheral resistin infusion (30 μg total over 5 h) but with IH Rs Ab treatment (gray bars), blockade of central resistin signaling was unable to repress SOCS-3 expression. No change on IKK-β, FAS, ACCα, SCD1, or PPARγ gene expression was noticed following peripheral resistin infusion in either group. (B and C) Parallel to changes in hepatic gene expression, SOCS-3 protein levels as analyzed by Western blot were elevated following i.v. resistin infusion, with no amelioration of this effect by central Rs Ab. The decrease of hepatic STAT3 protein and p-GSK3β levels also remained unaffected by central resistin blockade. No changes in p–IκB-α were detected following peripheral resistin administration in either cohort (black and gray bars) compared with vehicle (white bars). *P < 0.05 compared with vehicle; #P < 0.05 compared with Con Ab.

Similar articles

Cited by

References

    1. Adams K.F., et al. Overweight, obesity, and mortality in a large prospective cohort of persons 50 to 71 years old. N. Engl. J. Med. 2006;355:763–778. - PubMed
    1. Ogden C.L., et al. Prevalence of overweight and obesity in the United States, 1999-2004. JAMA. 2006;295:1549–1555. - PubMed
    1. Kahn B.B., Flier J.S. Obesity and insulin resistance. J. Clin. Invest. 2000;106:473–481. - PMC - PubMed
    1. Flier J.S. Obesity wars: molecular progress confronts an expanding epidemic. Cell. 2004;116:337–350. - PubMed
    1. Boden G., et al. Free fatty acids produce insulin resistance and activate the proinflammatory nuclear factor-kappaB pathway in rat liver. Diabetes. 2005;54:3458–3465. - PubMed

Publication types

MeSH terms