. 2007 Jul;35(Web Server issue):W186-92.
doi: 10.1093/nar/gkm323. Epub 2007 May 25.

GeneTrail--advanced gene set enrichment analysis

Affiliations

GeneTrail--advanced gene set enrichment analysis

Christina Backes et al. Nucleic Acids Res. 2007 Jul.

Abstract

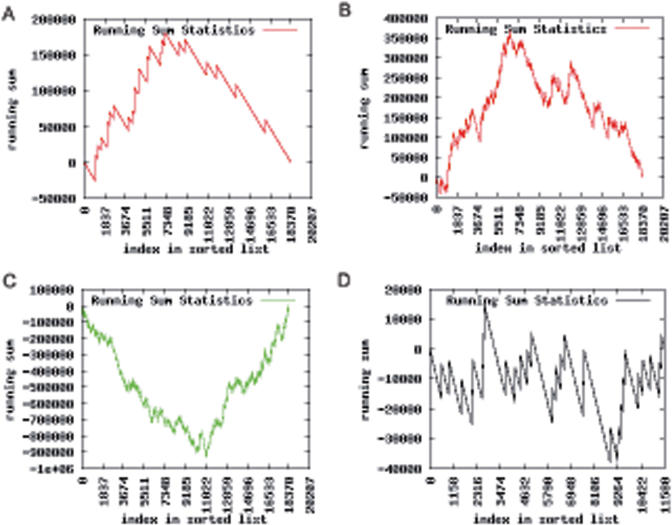
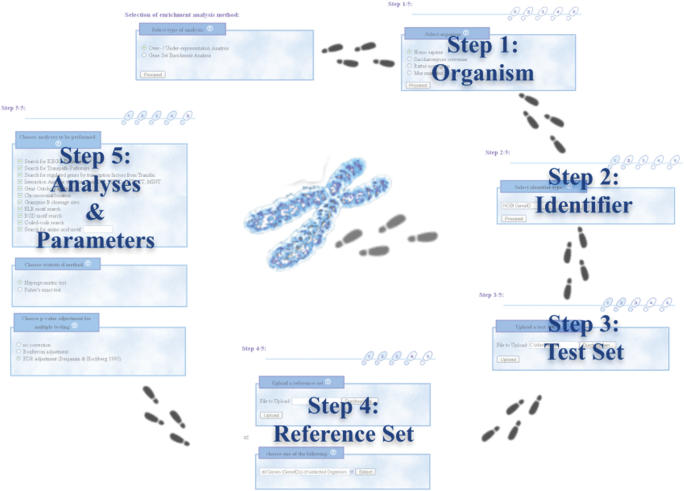
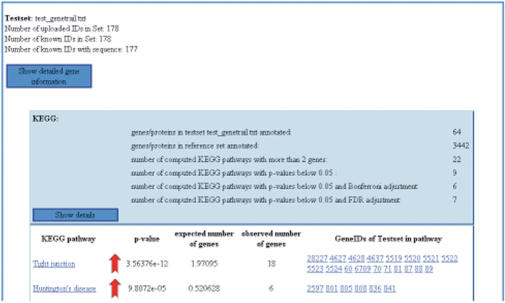
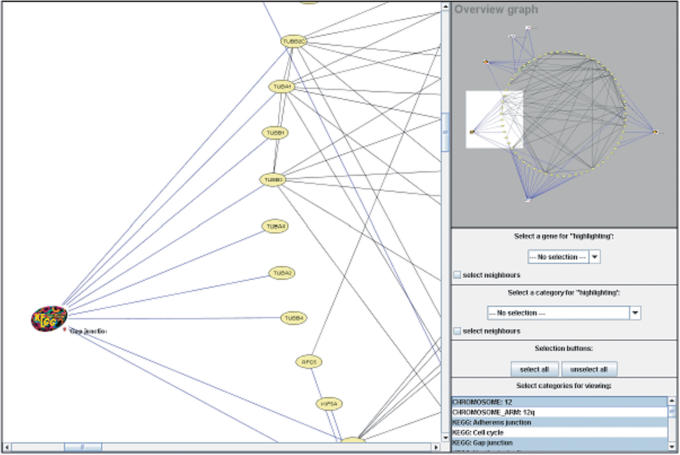
We present a comprehensive and efficient gene set analysis tool, called 'GeneTrail' that offers a rich functionality and is easy to use. Our web-based application facilitates the statistical evaluation of high-throughput genomic or proteomic data sets with respect to enrichment of functional categories. GeneTrail covers a wide variety of biological categories and pathways, among others KEGG, TRANSPATH, TRANSFAC, and GO. Our web server provides two common statistical approaches, 'Over-Representation Analysis' (ORA) comparing a reference set of genes to a test set, and 'Gene Set Enrichment Analysis' (GSEA) scoring sorted lists of genes. Besides other newly developed features, GeneTrail's statistics module includes a novel dynamic-programming algorithm that improves the P-value computation of GSEA methods considerably. GeneTrail is freely accessible at http://genetrail.bioinf.uni-sb.de.


Figures

Figure 1.
Figure 1.
Visualization of different running sum statistics when applying a ‘Gene Set Enrichment Analysis’. The running sum (y-axis) is shown as function of the index in the sorted list (x-axis). Part A and B of the figure illustrate a ‘mountain-like shape’ for top ranked genes. In part C, a ‘valley-like shape’ for bottom ranked genes is shown. Part D illustrates a ‘zigzag’ shape which is not statistically significant; the genes are randomly distributed.
Figure 2.
Figure 2.
This figure exemplifies the workflow of the GeneTrail server. The five steps needed to perform an ‘Over-Representation Analysis’ are shown in consecutive order. First, the organism and the identifier type have to be selected. Afterwards, a test set should be uploaded and a reference set can be uploaded or selected from a pre-defined list. Finally, the user can specify the desired analysis methods and the required parameters. For each step, we show small screenshots in the background taken from the GeneTrail user interface.
Figure 3.
Figure 3.
HTML view excerpt of the output of the ORA performed on the example set provided on the GeneTrail web server homepage. The illustration shows the two significant KEGG pathway categories with the highest P-value. The red arrows denote the over-representation of these two categories. If available, the categories and the genes are connected via weblink to their external data sources.
Figure 4.
Figure 4.
Graph visualization of the output of the ORA performed on the example set provided on the GeneTrail web server homepage. The left hand side shows an excerpt of the complete overview graph presented on the upper right. There are two types of nodes: oval nodes representing the genes in the example set and logos representing the categories. Blue edges connect the genes and the categories they are found in, black edges denote interactions of gene products.

References

    1. Ashburner M, Ball CA, Blake JA, Botstein D, Butler H, Cherry JM, Davis AP, Dolinski K, Dwight SS, et al. Gene Ontology: tool for the unification of biology. The Gene Ontology Consortium. Nat. Genet. 2000;25:25–29. - PMC - PubMed
    1. Al-Shahrour F, Diaz-Uriarte R, Dopazo J. FatiGO: a web tool for finding significant associations of Gene Ontology terms with groups of genes. Bioinformatics. 2004;20:578–580. - PubMed
    1. Maere S, Heymans K, Kuiper M. BiNGO: a Cytoscape plugin to assess overrepresentation of gene ontology categories in biological networks. Bioinformatics. 2005;21:3448–3449. - PubMed
    1. Beissbarth T, Speed TP. GOstat: find statistically overrepresented Gene Ontologies within a group of genes. Bioinformatics. 2004;20:1464–1465. - PubMed
    1. Lee HK, Braynen W, Keshav K, Pavlidis P. ErmineJ: tool for functional analysis of gene expression data sets. BMC Bioinformatics. 2005;6:269. - PMC - PubMed

Publication types