. 2007 Aug 15;93(4):1321-8.
doi: 10.1529/biophysj.107.103895. Epub 2007 May 25.

Static light scattering from concentrated protein solutions, I: General theory for protein mixtures and application to self-associating proteins

Affiliations

Static light scattering from concentrated protein solutions, I: General theory for protein mixtures and application to self-associating proteins

Allen P Minton. Biophys J. .

Abstract

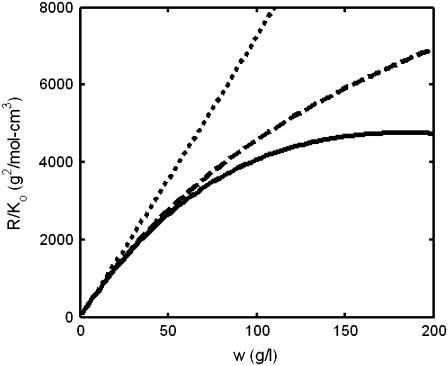
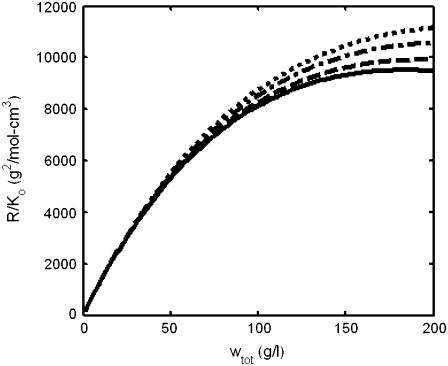
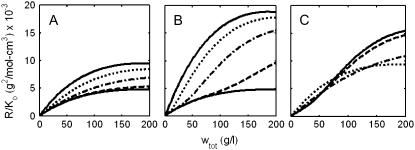
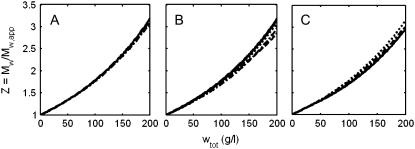
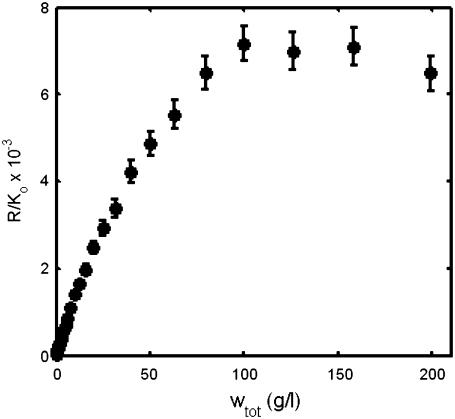
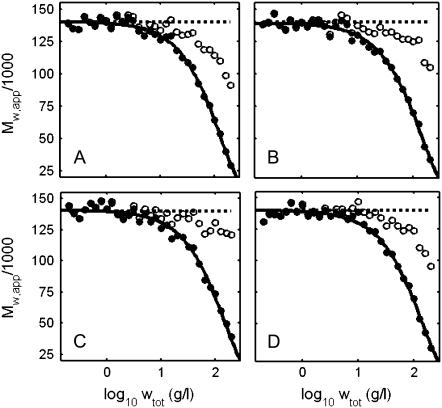
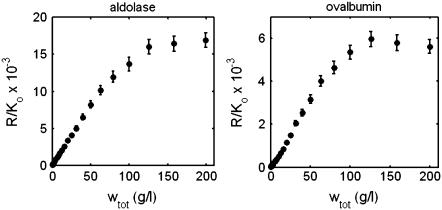
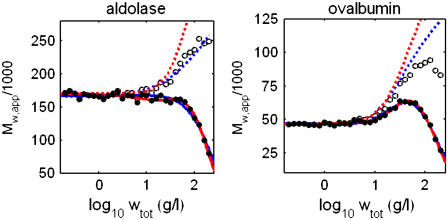
Exact expressions for the static light scattering of a solution containing up to three species of point-scattering solutes in highly nonideal solutions at arbitrary concentration are obtained from multicomponent scattering theory. Explicit expressions for thermodynamic interaction between solute molecules, required to evaluate the scattering relations, are obtained using an equivalent hard particle approximation similar to that employed earlier to interpret scattering of a single protein species at high concentration. The dependence of scattering intensity upon total protein concentration is calculated for mixtures of nonassociating proteins and for a single self-associating protein over a range of concentrations up to 200 g/l. An approximate semiempirical analysis of the concentration dependence of scattering intensity is proposed, according to which the contribution of thermodynamic interaction to scattering intensity is modeled as that of a single average hard spherical species. Simulated data containing pseudo-noise comparable in magnitude to actual experimental uncertainty are modeled using relations obtained from the proposed semiempirical analysis. It is shown that by using these relations one can extract from the data reasonably reliable information about underlying weak associations that are manifested only at very high total protein concentration.


Figures

FIGURE 1
FIGURE 1
Dependence of normalized scattering intensity upon concentration of a monomeric protein (molar mass M = 70 K) calculated with full accounting for excluded volume effects as described in text (solid line), calculated with a first-order correction for excluded volume (dashed line), and calculated with no correction for excluded volume (dotted line).
FIGURE 2
FIGURE 2
Dependence of normalized scattering intensity upon concentration of protein solutions of different composition but identical weight-average molar mass (Mw = 140 K). (Solid line) A single protein species with M = 140 K. (Dot-dashed line) A mixture of proteins with M1 = 70 K and M2 = 280 K in the mass ratio 2:1. (Dotted line) A mixture containing proteins with M1 = 70 K and M2 = 420 K in the mass ratio 4:1. (Dashed line) A mixture containing proteins with M1 = 70 K, M2 = 140 K, and M3 = 210 K in the mass ratio 1:1:1.
FIGURE 3
FIGURE 3
Dependence of normalized scattering intensity upon total protein concentration in solutions of a self-associating protein with M1 = 70 K. (A) Monomer-dimer. (Lower solid curve) Pure monomer; (upper solid curve) pure dimer; (dashed curve) K2 = 10 M−1; (dot-dashed curve) K2 = 100 M−1; (dotted curve) K2 = 1000 M−1. (B) Monomer-tetramer. (Lower solid curve) Pure monomer; (upper solid curve) pure tetramer; (dashed curve) K4 = 106 M−3; (dot-dashed curve) K4 = 108 M−3; (dotted curve) K4 = 1010 M−3. (C) Monomer-dimer-tetramer. (Solid curve) K2 = 0, K4 = 108 M−3; (dashed curve) K2 = 102 M−1, K4 = 108 M−3; (dot-dashed curve) K2 = 103 M−1, K4 = 108 M−3; (dotted curve), K2 = 104 M−1, K4 = 108 M−3.
FIGURE 4
FIGURE 4
Dependence of the ratio Mw/Mw,app upon total concentration of protein in solutions of a self-associating protein with M1 = 70 K. Reaction schemes and association constants within a given reaction scheme are the same as given in the caption to Fig. 3.
FIGURE 5
FIGURE 5
Simulated experimental dependence of R/Ko upon wtot for a solution containing an equal amount (by weight) of three proteins with molar masses 70 K, 140 K, and 210 K. Error bars correspond to ±2 SD.
FIGURE 6
FIGURE 6
Simulated experimental dependence of Mw,app (•) and calculated dependence of Mw,min (○) upon the logarithm of wtot for the following solutions of nonassociating proteins with Mw = 140 K: (A) 140 K; (B) 70:280 K 2:1; (C) 70:420 K 4:1; and (D) 70:140:210 K 1:1:1. Solid curves are calculated using Eq. 18 with the following best-fit parameter values: (A) Mw = 140 K, veq = 1.01. (B) Mw = 139 K, veq = 0.90. (C) Mw = 140 K, veq = 0.88. (D) 140 K, veq = 0.94.
FIGURE 7
FIGURE 7
Simulated experimental concentration dependence of light scattering of aldolase and ovalbumin solutions, calculated as described in the text. The data set for each protein is the mean of two data sets calculated using each of the alternate reaction schemes and parameter values specified in Table 1. Error bars correspond to ±2 SD.
FIGURE 8
FIGURE 8
Simulated experimental dependence of Mw,app (•) and Mw,min (○) upon the logarithm of wtot for solutions of aldolase (left panel) and ovalbumin (right panel), calculated by application of Eqs. 18 and 23, respectively, to the data sets plotted in Fig. 6. Solid curves are calculated using the CM approximation with best-fit equilibrium models and parameter values specified in Table 1. Dashed curves indicate estimates of actual Mw calculated using the corresponding best-fit parameter values. Best fits of different association schemes are distinguished by color as follows. Aldolase: monomer-dimer (blue) and monomer-trimer (red). Ovalbumin: monomer-trimer (blue) and monomer-dimer-tetramer (red).

References

    1. Ferrone, F. A., and M. A. Rotter. 2004. Crowding and the polymerization of sickle hemoglobin. J. Mol. Recog. 17:497–504. - PubMed
    1. Ponce, A., C. Sorensen, and L. Takemoto. 2006. Role of short-range protein interactions in lens opacifications. Mol. Vis. 12:879–884. - PubMed
    1. Shire, S. J., Z. Shahrokh, and J. Liu. 2004. Challenges in the development of high protein concentration formulations. J. Pharm. Sci. 93:1390–1402. - PubMed
    1. Muramatsu, N., and A. P. Minton. 1989. Hidden self-association of proteins. J. Mol. Recog. 1:166–171. - PubMed
    1. Chatelier, R. C., and A. P. Minton. 1987. Sedimentation equilibrium in macromolecular solutions of arbitrary concentration. I. Self-associating proteins. Biopolymers. 26:507–524. - PubMed

Publication types

LinkOut - more resources