. 2007 Sep 15;93(6):2069-82.
doi: 10.1529/biophysj.106.103481. Epub 2007 May 25.

Determination of the contribution of the myristoyl group and hydrophobic amino acids of recoverin on its dynamics of binding to lipid monolayers

Affiliations

Determination of the contribution of the myristoyl group and hydrophobic amino acids of recoverin on its dynamics of binding to lipid monolayers

Philippe Desmeules et al. Biophys J. .

Abstract

It has been postulated that myristoylation of peripheral proteins would facilitate their binding to membranes. However, the exact involvement of this lipid modification in membrane binding is still a matter of debate. Proteins containing a Ca(2+)-myristoyl switch where the extrusion of their myristoyl group is dependent on calcium binding is best illustrated by the Ca(2+)-binding recoverin, which is present in retinal rod cells. The parameters responsible for the modulation of the membrane binding of recoverin are still largely unknown. This study was thus performed to determine the involvement of different parameters on recoverin membrane binding. We have used surface pressure measurements and PM-IRRAS spectroscopy to monitor the adsorption of myristoylated and nonmyristoylated recoverin onto phospholipid monolayers in the presence and absence of calcium. The adsorption curves have shown that the myristoyl group and hydrophobic residues of myristoylated recoverin strongly accelerate membrane binding in the presence of calcium. In the case of nonmyristoylated recoverin in the presence of calcium, hydrophobic residues alone are responsible for its much faster monolayer binding than myristoylated and nonmyristoylated recoverin in the absence of calcium. The infrared spectra revealed that myristoylated and nonmyristoylated recoverin behave very different upon adsorption onto phospholipid monolayers. Indeed, PM-IRRAS spectra indicated that the myristoyl group allows a proper orientation and organization as well as faster and stronger binding of myristoylated recoverin to lipid monolayers compared to nonmyristoylated recoverin. Simulations of the spectra have allowed us to postulate that nonmyristoylated recoverin changes conformation and becomes hydrated at large extents of adsorption as well as to estimate the orientation of myristoylated recoverin with respect to the monolayer plane. In addition, adsorption measurements and electrophoresis of trypsin-treated myristoylated recoverin in the presence of zinc or calcium demonstrated that recoverin has a different conformation but a similar extent of monolayer binding in the presence of such ions.


Figures
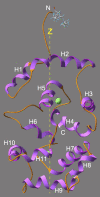
FIGURE 1
FIGURE 1
Structure of Ca2+-bound myristoylated recoverin ((28); 1jsa.pdb). The α-helices have been labeled H1-H11. C and N represent the C- and N-terminal parts of recoverin. The myristoyl moiety can be seen at the N-terminal. The z axis of recoverin has been taken as the normal to α-helix 2 (H2). The two solid green circles correspond to the bound calcium ions.
FIGURE 2
FIGURE 2
Typical Π-t adsorption isotherms of myristoylated (Myr) and nonmyristoylated (NonMyr) recoverin onto a DMPC monolayer (Π0 = 5 mN/m) in the presence (Myr + Ca2+ and NonMyr + Ca2+) or absence of calcium (Myr + EGTA and NonMyr + EGTA) into the subphase. The time zero corresponds to the injection of recoverin into the subphase. In all cases, the final concentration of recoverin was 50 nM. The subphase was: 1 mM HEPES, pH 7.5, 100 mM NaCl, and 1 mM CaCl2 (or 1 mM EGTA). (Inset) To better appreciate the kinetics of adsorption of myristoylated (Myr) and nonmyristoylated (NonMyr) recoverin in presence of calcium, the x axis has been extended to 1000 s. These data are representative of three independent experiments.
FIGURE 3
FIGURE 3
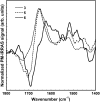
Typical PM-IRRAS spectra of myristoylated recoverin during its adsorption onto a DMPC monolayer in the presence of calcium (Π0 = 5 mN/m). Each PM-IRRAS spectrum was obtained during the 9 min of acquisition: spectra 1 (5–11.2 mN/m; 0–9 min), 2 (11.5–12.7 mN/m; 10–18 min), 3 (12.7–12.8 mN/m; 19–27 min), 4 (12.8–12.9 mN/m; 28–36 min), and 5 (12.9–13 mN/m; 37–45 min). Spectrum 6 has been measured using the stage of the Golden gate with a drop (5 μl) of a solution of recoverin at a concentration of 2.5 μg/ml. The subphase was 1 mM HEPES, pH 7.5, 100 mM NaCl, and 1 mM CaCl2. The final concentration of recoverin was 50 nM. These measurements were performed with a polarizer positioned in front of the detector as described earlier (62). These data are representative of two independent experiments.
FIGURE 4
FIGURE 4
Simulated spectra of myristoylated recoverin at different orientations (from θ = 0 to 90°) on the basis of its NMR structure (28). The z axis has been taken as the normal to α-helix 2 of recoverin (as well as several other α-helices). The orientation shown in Fig. 1 corresponds to θ = 0°.
FIGURE 5
FIGURE 5
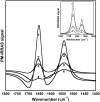
Typical PM-IRRAS spectra of nonmyristoylated recoverin during its adsorption onto a DMPC monolayer in the presence of calcium (Π0 = 5 mN/m). Each PM-IRRAS spectrum was obtained during the 9 min of acquisition: spectra 1 (7.9–9 mN/m, 0–9 min), 2 (9–11.3 mN/m, 10–18 min), 3 (11.3–12 mN/m, 19–27 min), 4 (12–12.5 mN/m; 28–36 min), 5 (12.5–12.7 mN/m, 37–45 min), and 6 (12.7–12.8 mN/m, 46–54 min). The subphase and the concentration of recoverin was the same as in Fig. 3. (Inset) Normalized spectra 4 from myristoylated (Myr) (Fig. 3) and nonmyristoylated (NonMyr) recoverin (this figure). These measurements were performed with a polarizer positioned in front of the detector as described earlier (62). These data are representative of two independent experiments.
FIGURE 6
FIGURE 6
Intensity of the amide I band as a function of time during monolayer adsorption of myristoylated (Myr) (Fig. 3) and nonmyristoylated (NonMyr) recoverin (Fig. 5) on a water subphase in the presence of calcium.
FIGURE 7
FIGURE 7
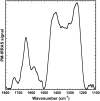
Normalized spectra 3–6 from Fig. 5.
FIGURE 8
FIGURE 8
Typical PM-IRRAS spectra of nonmyristoylated recoverin in the presence of calcium during its adsorption at the air-water interface (in the absence of a phospholipid monolayer). Each PM-IRRAS spectrum was obtained during the 9 min of acquisition: spectra 1 (0.7–2 mN/m, 0–9 min), 2 (2–3 mN/m, 10–18 min), 3 (4–6 mN/m, 19–27 min), 4 (9.5 mN/m, 28–36 min), 5 (9.6 mN/m, 37–45 min), and 6 (9.7 mN/m, 46–54 min). The subphase was the same as in Fig. 3. The final concentration of recoverin was 100 nM. These data are representative of three independent measurements.
FIGURE 9
FIGURE 9
Simulation of the effect of different parameters on the spectrum of polybenzylglutamate on a water subphase: increase of the bandwidth from 40 (spectrum 1) to 60 cm−1 (spectrum 2); increase of protein hydration to 50% with a bandwidth of 60 cm−1 (spectrum 3); and 50% dielectric water with a bandwidth of 60 cm−1 (spectrum 4). (Inset) Simulation of the effect of different parameters on the spectrum of polybenzylglutamate on a D2O subphase: increase of the bandwidth from 40 (spectrum 1) to 60 cm−1 (spectrum 2); increase of protein hydration to 50% with D2O using a bandwidth of 60 cm−1 (spectrum 3); and 50% dielectric D2O with a bandwidth of 60 cm−1 (spectrum 4).
FIGURE 10
FIGURE 10
Typical PM-IRRAS spectrum of myristoylated recoverin bound onto a DMPC monolayer in presence of calcium using a D2O subphase. The initial surface pressure of the phospholipid monolayer was 5 mN/m. The spectrum was recorded during the adsorption of myristoylated recoverin within a range of 5–14 mN/m of surface pressure change. The subphase was 1 mM HEPES, pD 7.9, 100 mM NaCl, 1 mM CaCl2 (pD = pH + 0.4). The final concentration of recoverin was 50 nM. These data are representative of five independent experiments.
FIGURE 11
FIGURE 11
Typical PM-IRRAS spectra of myristoylated recoverin during its adsorption onto a DMPC monolayer in presence of calcium using a D2O subphase. Each PM-IRRAS spectrum was obtained during the 9 min of acquisition: spectra 1 (15–19.4 mN/m, 0–9 min); 2 (19.4 mN/m, 10–18 min); 3 (19.3 mN/m, 19–27 min); and 4 (19.3 mN/m, 28–36 min). Conditions are the same as Fig. 10. These data are representative of two independent measurements.
FIGURE 12
FIGURE 12
Typical PM-IRRAS spectra of nonmyristoylated recoverin during its adsorption onto a DMPC monolayer in presence of calcium using a D2O subphase. Each PM-IRRAS spectrum was obtained during the 9 min of acquisition: spectra 1 (15–19 mN/m, 0–9 min); 2 (19.1–19.3 mN/m, 10–18 min); and 3 (19.3 mN/m, 19–27 min). Conditions are the same as Fig. 10. These data are representative of two independent measurements.
FIGURE 13
FIGURE 13
Intensity of the amide I′ band as a function of time during monolayer adsorption of myristoylated (Myr) (Fig. 11) and nonmyristoylated (NonMyr) recoverin (Fig. 12) on a D2O subphase in the presence of calcium.
FIGURE 14
FIGURE 14
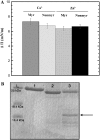
(A) Histogram of the surface pressure increase (ΔΠ) upon myristoylated and nonmyristoylated recoverin adsorption onto a DMPC monolayer at an initial pressure of 10 mN/m in the presence of calcium or zinc. The subphase was 1 mM HEPES, pH 7.5, 100 mM NaCl, 1 mM CaCl2, or 1 mM ZnCl2. The final concentration of recoverin was 50 nM. The error bar is the standard deviation calculated from three independent measurements for each individual experimental condition assayed. (B) SDS-PAGE gel electrophoresis of the undigested myristoylated recoverin (lane 1) and of myristoylated recoverin after proteolysis by TPCK-trypsin in presence of calcium (lane 2) or zinc (lane 3). The lane (L) is the protein ladder.

Similar articles

Cited by

References

    1. Kinnunen, P. K. J., A. Kõiv, J. Y. A. Lehtonen, M. Rytömaa, and P. Mustonen. 1994. Lipid dynamics and peripheral interactions of proteins with membrane surfaces. Chem. Phys. Lipids. 73:181–207. - PubMed
    1. Marsh, D., and T. Páli. 2004. The protein-lipid interface: perspectives from magnetic resonance and crystal structures. Biochim. Biophys. Acta. 1666:118–141. - PubMed
    1. Grenier, S., P. Desmeules, A. K. Dutta, A. Yamazaki, and C. Salesse. 1998. Determination of the depth of penetration of the α subunit of retinal G protein in membranes: a spectroscopic study. Biochim. Biophys. Acta. 1370:199–206. - PubMed
    1. Arbuzova, A., A. A. P. Schmitz, and G. Vergères. 2002. Cross-talk unfolded: MARKS proteins. Biochem. J. 362:1–12. - PMC - PubMed
    1. Desmeules, P., M. Grandbois, V. A. Bonderenko, A. Yamazaki, and C. Salesse. 2002. Measurement of membrane binding between recoverin, a calcium-myristoyl switch protein, and lipid bilayers by AFM-based force spectroscopy. Biophys. J. 82:3343–3350. - PMC - PubMed

Publication types

MeSH terms

LinkOut - more resources