. 2007 Sep 15;93(6):1960-80.
doi: 10.1529/biophysj.107.105478. Epub 2007 May 25.

Steric selectivity in Na channels arising from protein polarization and mobile side chains

Affiliations

Steric selectivity in Na channels arising from protein polarization and mobile side chains

Dezso Boda et al. Biophys J. .

Abstract

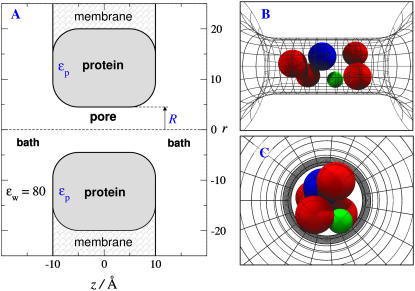
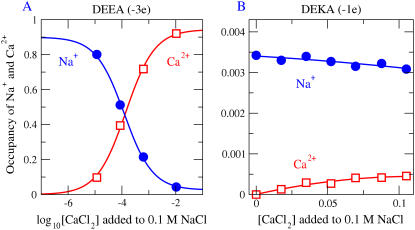
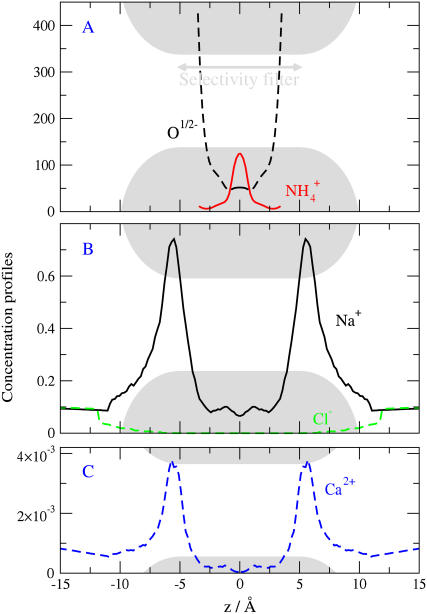
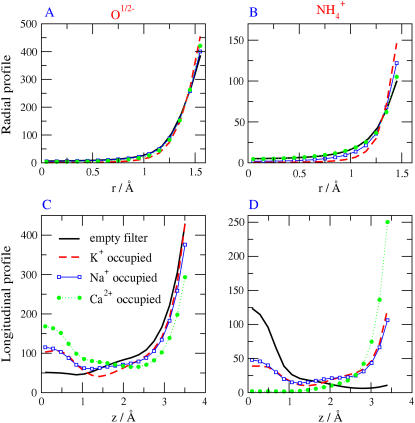
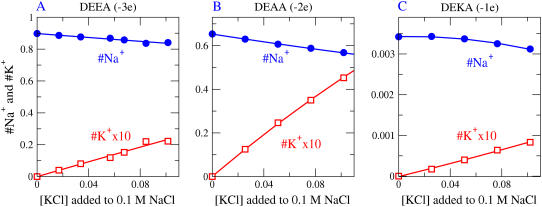
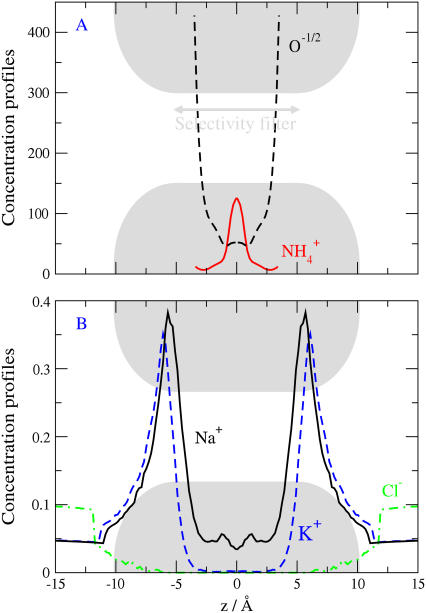
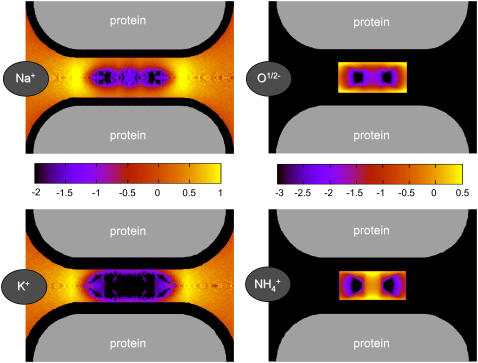
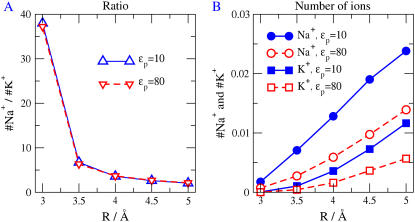
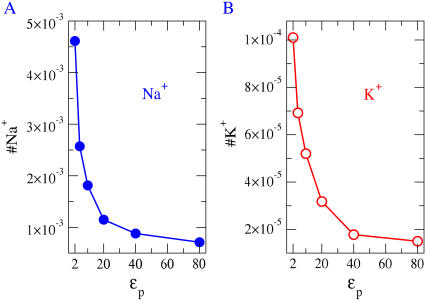
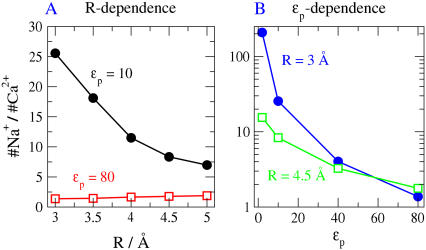
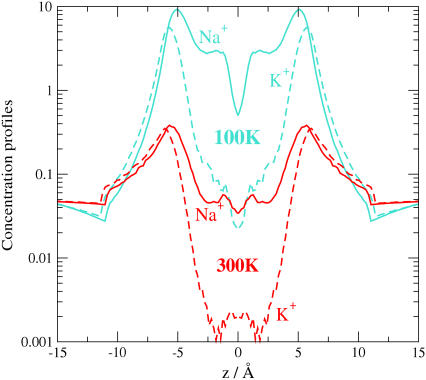
Monte Carlo simulations of equilibrium selectivity of Na channels with a DEKA locus are performed over a range of radius R and protein dielectric coefficient epsilon(p). Selectivity arises from the balance of electrostatic forces and steric repulsion by excluded volume of ions and side chains of the channel protein in the highly concentrated and charged (approximately 30 M) selectivity filter resembling an ionic liquid. Ions and structural side chains are described as mobile charged hard spheres that assume positions of minimal free energy. Water is a dielectric continuum. Size selectivity (ratio of Na+ occupancy to K+ occupancy) and charge selectivity (Na+ to Ca2+) are computed in concentrations as low as 10(-5) M Ca2+. In general, small R reduces ion occupancy and favors Na+ over K+ because of steric repulsion. Small epsilon(p) increases occupancy and favors Na+ over Ca2+ because protein polarization amplifies the pore's net charge. Size selectivity depends on R and is independent of epsilon(p); charge selectivity depends on both R and epsilon(p). Thus, small R and epsilon(p) make an efficient Na channel that excludes K+ and Ca2+ while maximizing Na+ occupancy. Selectivity properties depend on interactions that cannot be described by qualitative or verbal models or by quantitative models with a fixed free energy landscape.


Figures

FIGURE 1
FIGURE 1
The channel model. Computations are done in a much larger region than shown (see text). (A) Baths containing bulk solution on either side of a membrane containing a channel protein. (B,C) Snapshots of ions in the pore (−10 Å < z < 10 Å). The cross-sectional view Fig. 1 C vividly shows the crowding of ions and the competition for space in the narrow pore. The dielectric coefficient of the bulk solution is ɛw = 80. The dielectric coefficient of the protein is ɛp, ranging from 2 to 80. Side chains are restricted to the central region of the channel (−5 Å < z < 5 Å) which is called the selectivity filter for that reason. The selectivity filter has spatially nonuniform selectivity (see Fig. 7) and so later figures plot occupancy in the central most selective region of the filter ±2.5 Å from the center of the pore.
FIGURE 2
FIGURE 2
Simulations give titration curves typical of a Ca2+ or Na+ channel. Titration curves show Na+ versus Ca2+ selectivity for a DEEA Ca2+ channel (charge −3e) and a DEKA Na channel (charge = −1e) for R = 3 and ɛp = 10. The concentration of NaCl is kept fixed at 0.1 M while CaCl2 is gradually added. We measure the number (occupancy) of the various cations (Na+ and Ca2+) as a function of [CaCl2] in the 5 Å long central portion of the 10 Å filter, the most selective region of the pore (see Fig. 7). The mutation of the DEKA locus into DEEA changes a lysine K (+1 charge) into a glutamate E (−1 charge). In our model, the side chains of DEEA are represented as six half-charged oxygen ions (O½−); the side chains of DEKA are represented as four oxygen ions and one formula image ion. The effect of charge and excluded volume is clearly seen in the plot: DEEA is highly Ca2+ selective in our model, while the DEKA is highly Na+ selective in these solutions. Genetic drift and stochastic mutation could frequently convert K ↔ E and vice versa, giving evolution repeated chances to select the side chain best for each cellular function.
FIGURE 3
FIGURE 3
The distribution along the central axis of the channel of structural ions (upper panel A) and mobile ions (lower panels) in a DEKA Na+ channel of radius 3 Å; with protein dielectric coefficient 10; in bathing solutions [CaCl2] = 1 mM and [NaCl] = 100 mM. The channel boundaries are represented by shaded ∪ and ∩ lines touching the horizontal lines that define the figure. The location of the peaks of concentration depends on conditions. A binding site at a fixed location does not describe the peaks of concentration. Ion-specific effects (selectivity) are more apparent in the central part of the channel z = 0, where the concentration of Ca2+ is nearly zero, than at the peaks of concentration. The concentrations in this and other figures are determined using the volume accessible to the center of each type of ion. The spatial localization of binding is discussed in Results and in the caption to Fig. 6.
FIGURE 4
FIGURE 4
The effect of ion contents in profiles in a DEKA Na channel. (A,C) Distribution of O½−; (B,D) Distribution of formula image The selectivity filter has spatially nonuniform selectivity (see Fig. 7) and so we define and plot occupancy in the central most selective region of the filter ±2.5 Å from the center of the pore. This region is either occupied by one Na+ ion; or one K+ ion; or one Ca2+ ion; or the filter is empty. The longitudinal distribution of side chain structural ions (O½− and formula image) is shown in the lower two panels of C and D. The radial distribution of side chains is shown in the upper two panels of A and B. Filters labeled empty contained side-chain structural ions but no Na+, K+, or Ca2+ ion.
FIGURE 5
FIGURE 5
The occupancy of the central selectivity filter ±2.5 Å from the center of the pore as a function of [KCl] for the DEEA Ca channel (charge = −3e), the DEAA mutant channel (charge = −2e), and the DEKA Na channel (charge = −1e).
FIGURE 6
FIGURE 6
Longitudinal concentration profiles for various ions in the DEKA Na channel (charge = −1e). R = 3Å, ɛp = 10, and [NaCl] = [KCl] = 0.05 M. This figure shows selectivity by depletion within the filter and binding outside the filter. The binding is not selective and occurs because the pressure arising from the excluded volume of ions and side chains forces the counterions to dwell near rather than in the filter region. Counterions accumulate at the filter entrances to the filter because they are electrostatically attracted to it but they cannot fit within the filter. This is an essential feature of the charge-space competition mechanism of selectivity.
FIGURE 7
FIGURE 7
Contour plots in and around for various ions in the DEKA locus (R = 3Å, ɛp = 10, and [NaCl] = [KCl] = 0.05 M). Black represents negligible concentration. Plots show log10(c/cref) where cref is a reference concentration. The value cref is the bulk concentration for the K+ and Na+ ions (0.05 M), while it is the average concentration in the filter for the structural ions (66.6 M) for O1/2− and 18.9 M for formula image These average concentrations are determined using the volume accessible to the centers of each type of ions.
FIGURE 8
FIGURE 8
The occupancies of Na+ and K+ ions as a function of R for two different protein dielectric coefficients of the protein (ɛp = 10 and 80). (A) The ratio of the occupancies of Na+ and K+ as a function of R. The electrolyte is equimolar: [NaCl] = [KCl] = 0.05 M. The protein dielectric coefficient has no effect on the ratio and thus on this measure of size selectivity. (B) The protein dielectric coefficient has a large effect on occupancy and thus we suspect on the conductance of the channel. The selectivity filter has spatially nonuniform selectivity (see Fig. 7) and so we define and plot occupancy in the central most selective region of the filter ±2.5 Å from the center of the pore.
FIGURE 9
FIGURE 9
The occupancies of Na+ and K+ ions as a function of ɛp for R = 3 Å. The electrolyte is equimolar: [NaCl] = [KCl] = 0.05 M. The protein dielectric coefficient has a large effect on occupancy and thus (most likely) on the conductance of the channel even though it has little effect on the selectivity, i.e., the ratios of occupancies seen in Fig. 7 A, left-hand panel. The selectivity filter has spatially nonuniform selectivity (see Fig. 7) and so we define and plot occupancy in the central most selective region of the filter ±2.5 Å from the center of the pore.
FIGURE 10
FIGURE 10
The ratio of the occupancies of Na+ and Ca2+ ions (A) as a function of pore radius R for two different protein dielectric coefficients of the protein (ɛp = 10 and 80) and (B) as a function of ɛp for two different radii of the pore (R = 3 and 4.5 Å). The bath Ca2+ concentration is 17.5 mM. Protein dielectric coefficient has little effect on Na+ versus Ca2+ selectivity when the protein dielectric coefficient is large, but it has a substantial effect when the protein dielectric coefficient is small. The radius of Na+ and Ca2+ are nearly the same (Na+ = 1, Ca2+ = 0.99 Å) so this graph shows charge selectivity. The selectivity filter has spatially nonuniform selectivity (see Fig. 7) and so we define and plot occupancy in the central most-selective region of the filter ±2.5 Å from the center of the pore.
FIGURE 11
FIGURE 11
Longitudinal concentration profiles for Na+ and K+ ions in the DEKA locus for crystallographic temperature 100 K (blue lines) and biological temperature 300 K (red lines). Pore radius is R = 3 Å, protein dielectric coefficient is ɛp = 10, and [NaCl] = [KCl] = 0.05 M, the same situation as in Fig. 5. Note the profound effect of temperature. Barriers and wells are frozen into the structure at crystallographic temperatures because entropy is low. The profile shows little such structure at biological temperature where entropic disorder is much larger. Measurements made at one temperature give qualitatively different results from those at another.

Similar articles

Cited by

References

    1. Hodgkin, A. L., and B. Katz. 1949. The effect of sodium ions on the electrical activity of the giant axon of the squid. J. Physiol. 108:37–77. - PMC - PubMed
    1. Hodgkin, A., A. Huxley, and B. Katz. 1949. Ionic currents underlying activity in the giant axon of the squid. Arch. Sci. Physiol. (Paris). 3:129–150.
    1. Dixon, M., and E. C. Webb. 1979. Enzymes. Academic Press, New York.
    1. Fersht, A. 1985. Enzyme Structure and Mechanism. Freeman, New York.
    1. Hille, B. 2001. Ionic Channels of Excitable Membranes. Sinauer Associates, Sunderland, MA.

Publication types

LinkOut - more resources