. 2007 Aug 15;93(4):1380-90.
doi: 10.1529/biophysj.107.105007. Epub 2007 May 25.

Force-response considerations in ciliary mechanosensation

Affiliations

Force-response considerations in ciliary mechanosensation

Andrew Resnick et al. Biophys J. .

Erratum in

  • Biophys J. 2008 Jan 15;94(2):714

Abstract

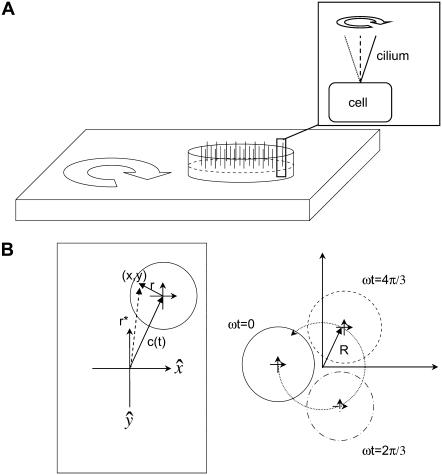
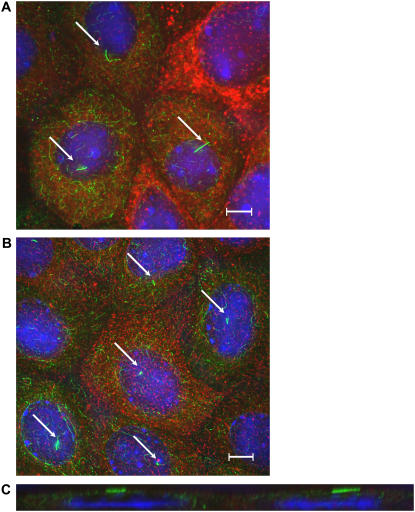
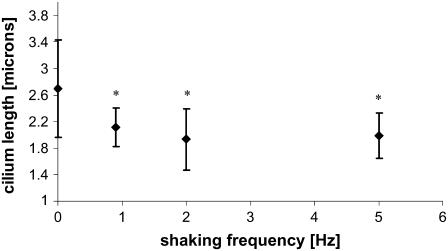
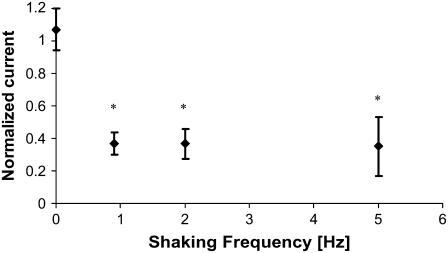
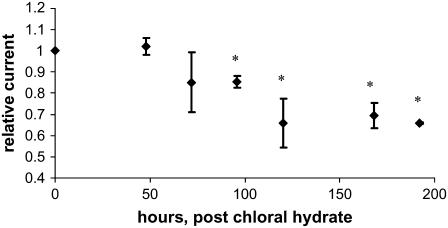
Considerable experimental evidence indicates that the primary, nonmotile cilium is a mechanosensory organelle in several epithelial cell types. As the relationship between cellular responses and nature and magnitude of applied forces is not well understood, we have investigated the effects of exposure of monolayers of renal collecting duct chief cells to orbital shaking and quantified the forces incident on cilia. An exposure of 24 h of these cells to orbital shaking resulted in a decrease of amiloride-sensitive sodium current by approximately 60% and ciliary length by approximately 30%. The sensitivity of the sodium current to shaking was dependent on intact cilia. The drag force on cilia due to induced fluid flow during orbital shaking was estimated at maximally 5.2x10(-3) pN at 2 Hz, approximately 4 times that of thermal noise. The major structural feature of cilia contributing to their sensitivity appears to be ciliary length. As more than half of the total drag force is exerted on the ciliary cap, one function of the slender stalk may be to expose the cap to greater drag force. Regardless, the findings indicate that the cilium is a mechanosensory organelle with a sensitivity much lower than previously recognized.


Figures

FIGURE 1
FIGURE 1
Geometry of orbital shaking and buoyancy forces. (A) Shaker table with filter insert containing a confluent monolayer of cells each with a single apical primary cilium (inset). The cilium pivots around its cellular anchoring point. (B) Movement of a point (x,y) on an orbital shaker relative to the laboratory frame defined by directions formula image which are fixed. (Left frame) The vector r*(t) = x(t),y(t) is composed of a vector to the center of the monolayer c(t) and the time-independent vector r from the center of the monolayer to the point (x,y). (Right frame) Illustration of the movement of all points on the monolayer in the laboratory frame (coordinates): ω = shaking frequency, t = time, R = orbital throw. The circles represent the position as a function of time. The crossed arrows in the center indicate the orientation of the monolayer, showing that formula image remain constant in both the laboratory and monolayer frame (absence of rotation around the monolayer center).
FIGURE 2
FIGURE 2
Comparison of ciliary length between nonshaken (A) and shaken (B) monolayers of mCD cells. (A and B) En face images of cells stained with an antibody for acetylated α-tubulin (green) and counterstained with wheat germ agglutinin for apical surface glycoproteins (red) and DAPI for nucleic acids (blue). The primary cilia (indicated by arrows) are clearly visible. Images have been deconvolved. Scale bar is 5 μm. (C) x-z slice of a showing primary cilia lying against the apical surface.
FIGURE 3
FIGURE 3
Effect of shaking on cilia length. mCD cell monolayers were incubated without or with shaking for 24 h at the indicated frequency. The ciliary length was measured from images acquired after fixation and staining as in Fig. 2. Asterisks indicate a p < 0.01 compared to unshaken monolayers.
FIGURE 4
FIGURE 4
Effect of shaking on the magnitude of ENaC activity, measured as amiloride-sensitive Isceq. mCD cell monolayers were incubated with or without shaking for 24 h at the indicated frequency. Isceq was measured immediately after termination of shaking and normalized relative to Isceq of unshaken monolayers. The absolute value for the control short-circuit current Isc is ∼10 μA/cm2, with a standard deviation of ∼1 μA/cm2. Number of unshaken control monolayers = 20; number of shaken monolayers = 16 at each frequency. Asterisks indicate a p < 0.01 compared to unshaken monolayers. The effect of shaking on ENaC current is already maximal at the lowest frequency tested. The same experiment was performed with monolayers exhibiting higher Isc, ∼50 μA/cm2, with the same results (data not shown).
FIGURE 5
FIGURE 5
Recovery of sensitivity of Isceq to shaking after treatment with chloral hydrate. Monolayers were treated with 4 mM chloral hydrate for 4 days. After removal of chloral hydrate, some monolayers were placed on the orbital shaker at a frequency of 0.9 Hz and the others served as unshaken controls. Relative current is defined as the ratio of Isceq from shaken monolayers to those from unshaken monolayers. Amiloride-sensitive Isceq of the unshaken control monolayers recovers to the prechloral hydrate state within 24 h. The response of Isceq to shaking recovers with a time constant of ∼100 h. The absolute value for the control short-circuit current Isc was ∼10 μA/cm2, with a standard deviation of ∼1 μA/cm2. The resistance of the shaken and unshaken monolayers averaged 1.5 ± 0.6 kΩ/cm2 and 1.2 ± 0.4 kΩ/cm2, respectively. The number of unshaken monolayers = 5, the number of shaken monolayers = 10. Asterisks indicate a p < 0.01 compared to unshaken monolayers.
FIGURE 6
FIGURE 6
Fluid flow measurements by particle image velocimetry. The figure shows a sample frame of a particle-tracking movie. Only partial track is shown for clarity. Particle “1” is located ∼5 μm from the bottom surface; particle “2” is attached to bottom surface. Scale bar is 25 μm. Arrows indicate other spheres in the field of view. Note that the illumination is from the side, not from below.
FIGURE 7
FIGURE 7
Measured particle velocities for 2 Hz orbital shaking as a function of height from the bottom surface. Inset is the region near the bottom surface and shows a quadratic fit.
FIGURE 8
FIGURE 8
Range of inertial force at cilium tip and drag force in published experiments. The log-log plot shows microscopic Reynolds numbers at cilium tip against the total drag force on the cilium normalized for length (scaled drag force). The Reynolds number is as defined in Eq. 5, assuming viscosity and density of water at the appropriate temperature. If the velocity was not directly measured, it was calculated assuming Poiseuille flow within the tubule or channel. The drag force includes the contributions from both cilium cap and cylinder, i.e., sum of formula image (Eqs. 3 and 6 with formula image integrated over the length of the cilium). The scaled ciliary drag force = formula image The data are from published experiments as indicated by the reference. (+) An experiment in which no cellular response (elevation of cytosolic calcium) was observed. In that experiment, the matched positive controls with a cellular response (elevated cytosolic calcium) are designated by the symbol “×”.

References

    1. Davenport, J. R., and B. K. Yoder. 2005. An incredible decade for the primary cilium: a look at a once-forgotten organelle. Am. J. Physiol. Renal Physiol. 289:F1159–F1169. - PubMed
    1. Alieva, I. B., and I. A. Vorobjev. 2004. Vertebrate primary cilia: a sensory part of centrosomal complex in tissue cells, but a “sleeping beauty” in cultured cells? Cell Biol. Int. 28:139–150. - PubMed
    1. Praetorius, H. A., and K. R. Spring. 2005. A physiological view of the primary cilium. Annu. Rev. Physiol. 67:515–529. - PubMed
    1. Pazour, G. J., and G. B. Witman. 2003. The vertebrate primary cilium is a sensory organelle. Curr. Opin. Cell Biol. 15:105–110. - PubMed
    1. Praetorius, H. A., and K. R. Spring. 2001. Bending the MDCK cell primary cilium increases intracellular calcium. J. Membr. Biol. 184:71–79. - PubMed

Publication types