. 2007 Aug 15;93(4):1204-14.
doi: 10.1529/biophysj.107.108886. Epub 2007 May 25.

Effects of cholesterol on dry bilayers: interactions between phosphatidylcholine unsaturation and glycolipid or free sugar

Affiliations

Effects of cholesterol on dry bilayers: interactions between phosphatidylcholine unsaturation and glycolipid or free sugar

Antoaneta V Popova et al. Biophys J. .

Abstract

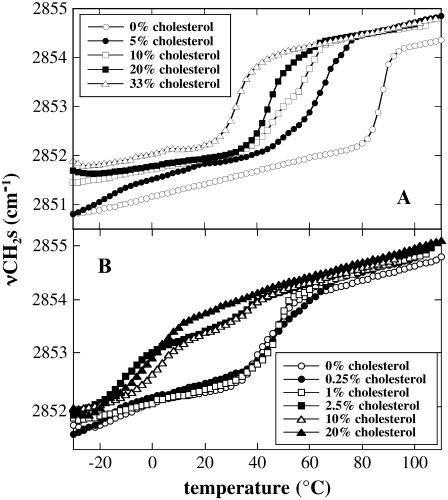
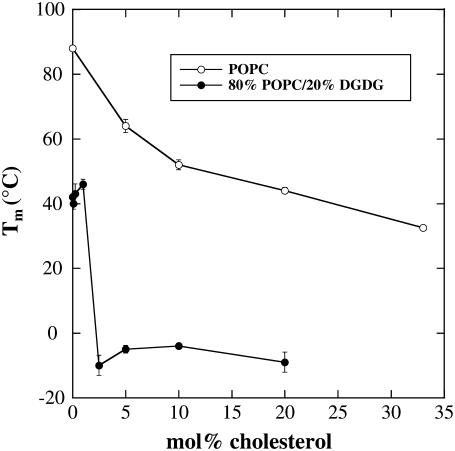
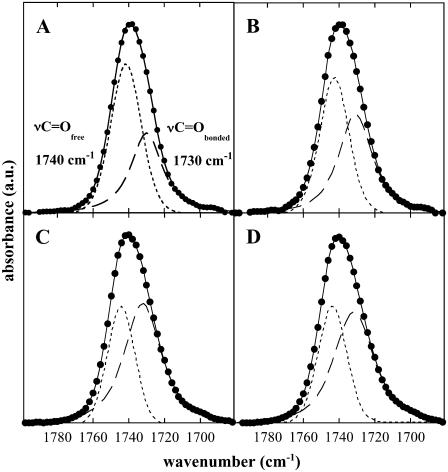
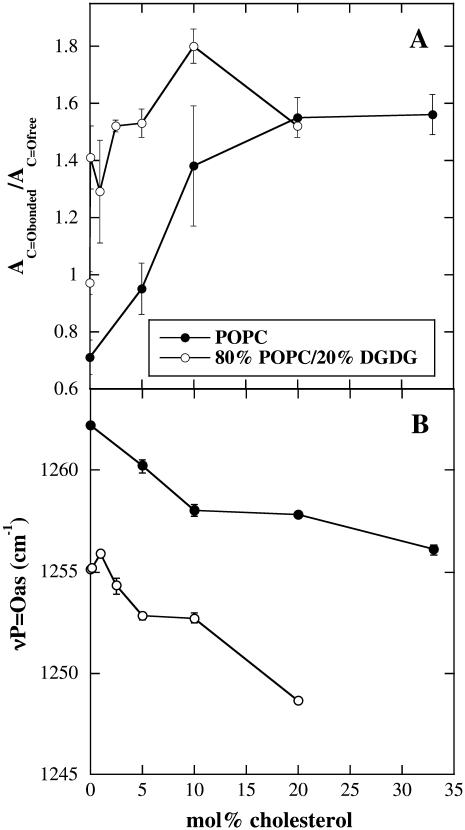
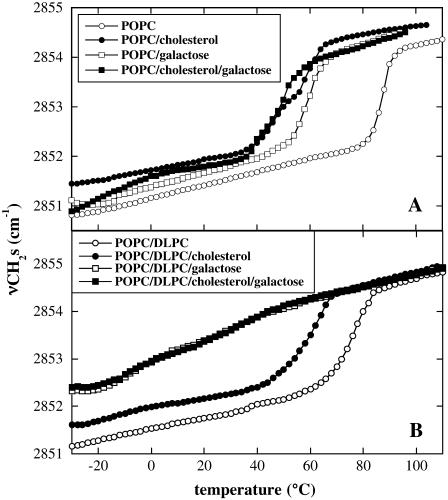
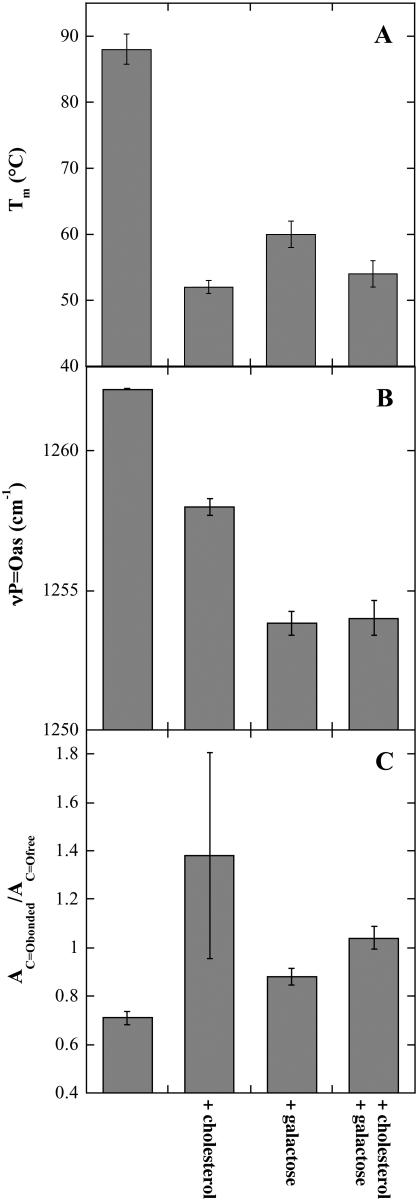
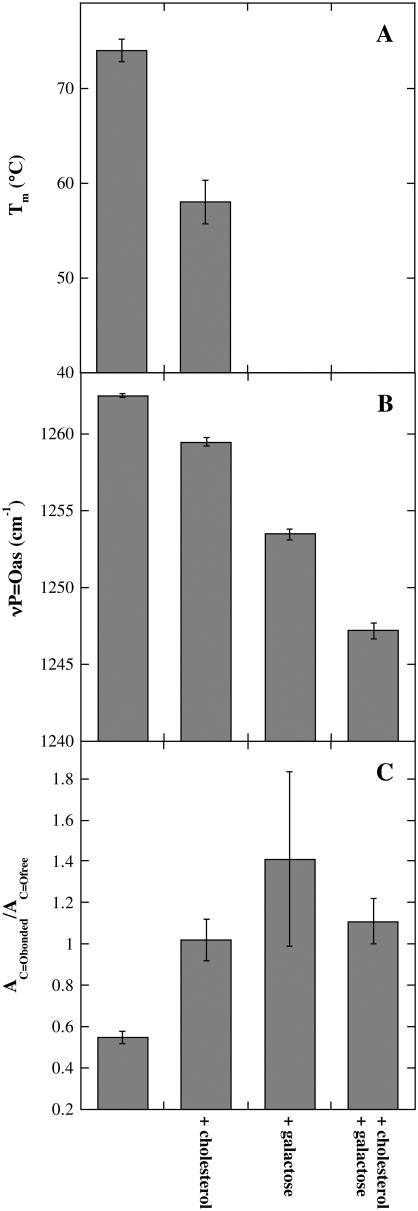
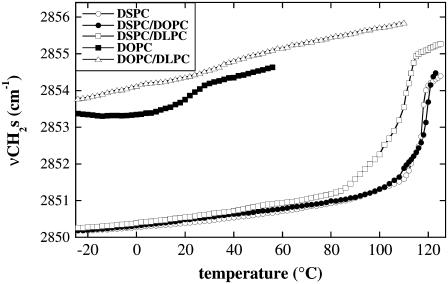
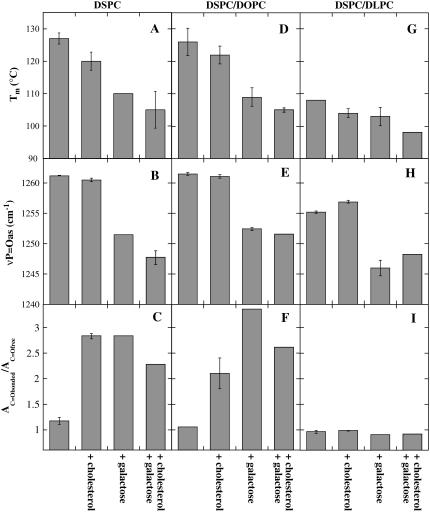
Cholesterol and other sterols are important components of biological membranes and are known to strongly influence the physical characteristics of lipid bilayers. Although this has been studied extensively in fully hydrated membranes, little is known about the effects of cholesterol on the stability of membranes in the dry state. Here, we present a Fourier transform infrared spectroscopy study on the effects of cholesterol on the phase behavior of dry liposomes composed of phosphatidylcholines with different degrees of fatty acid unsaturation or of mixtures of phosphatidylcholine with a plant galactolipid. In addition, we have analyzed the H-bonding of cholesterol, galactose, and a combination of the two additives to the P=O and C=O groups in dry phosphatidylcholine bilayers. The data indicate a complex balance of interactions between the different components in the dry state and a strong influence of fatty acid unsaturation on the interactions of the diacyl lipids with both cholesterol and galactose.


Figures

FIGURE 1
FIGURE 1
Lipid melting curves of dry liposomes prepared from POPC (A) or 80% POPC/20% DGDG (B). The temperature-dependent increase in the position of the symmetric CH2 stretching band (νCH2s) of fatty acyl chains was determined by FTIR spectroscopy. The diacyl lipids were mixed with different fractions of Chol as indicated.
FIGURE 2
FIGURE 2
Lipid phase transition temperature (Tm) of dry liposomes prepared from POPC or 80% POPC/20% DGDG as a function of the Chol content of the membranes. Tm was determined as the midpoint of the melting curves shown in Fig. 1. The error bars indicate mean ± SE from measurements on three samples. Where no error bars are visible, they are smaller than the symbols.
FIGURE 3
FIGURE 3
Infrared spectra in the carbonyl stretching region (νC=O) of dry POPC (A and B) or 80% POPC/20% DGDG (C and D) liposomes. Samples in A and C contained only the diacyl lipids, whereas samples in B and D contained 33 mol % and 20 mol % Chol, respectively. Spectra were recorded at 90°C. The peaks were deconvoluted and fitted into two band components designated as νC=Ofree at ∼1740 cm−1 (upfield peak, no H-bonding) and as νC=Obonded at ∼1730 cm−1 (lowfield peak, H-bonded). The curve of the original peak comprises both the measured and the fitted curves.
FIGURE 4
FIGURE 4
Effect of different mol fractions of Chol on (A) the ratio of the fitted peak areas of the two νC=O band components (AC=Obonded/AC=Ofree) described in Fig. 3 and on (B) the position of the νP=Oas vibration. In addition to the indicated fractions of Chol, liposomes contained either pure POPC or 80% POPC/20% DGDG as indicated. Spectra were obtained from dry liposomes at 90°C. The error bars indicate mean ± SE from measurements on three samples.
FIGURE 5
FIGURE 5
Temperature dependence of νCH2s of dry liposomes prepared from POPC (A) or 80% POPC/20% DLPC (B). Where indicated, the membranes contained 10 mol % Chol in addition to the phospholipids. Liposomes were either prepared in water or in 22.2 mM Gal, corresponding to the amount of sugar present in liposomes containing 20% DGDG.
FIGURE 6
FIGURE 6
Lipid phase transition temperature (Tm; A), the νP=Oas peak position (B), and AC=Obonded/AC=Ofree ratio (C) determined from dry POPC liposomes. νP=Oas and νC=O spectra were recorded at 90°C. The samples contained additional Chol and Gal as indicated (compare Fig. 5). The error bars indicate mean ± SE from measurements on three samples.
FIGURE 7
FIGURE 7
Lipid phase transition temperature (Tm; A), the νP=Oas peak position (B), and AC=Obonded/AC=Ofree ratio (C) determined from dry liposomes composed of 80% POPC/20% DLPC. νP=Oas and νC=O spectra were recorded at 90°C. The samples contained additional Chol and Gal as indicated (compare Fig. 5). The error bars indicate mean ± SE from measurements on three samples.
FIGURE 8
FIGURE 8
Temperature-dependent increase in νCH2s of dry liposomes composed of the following: 100% DSPC, 80% DSPC/20% DOPC, 80% DSPC/20% DLPC, 100% DOPC, or 80% DOPC/20% DLPC.
FIGURE 9
FIGURE 9
Lipid phase transition temperature (Tm; A, D, and G), the νP=Oas peak position (B, E, and H), and AC=Obonded/AC=Ofree ratio (C, F, and I) determined from dry liposomes composed of the following: 100% DSPC, 80% DSPC/20% DOPC, or 80% DSPC/20% DLPC. νP=Oas and νC=O spectra were recorded at 140°C. The samples contained additional Chol and Gal as indicated (compare Fig. 5). The error bars indicate mean ± SE from measurements on three samples.
FIGURE 10
FIGURE 10
Schematic representation of the packing of Chol and POPC molecules in dry membranes. In the gel phase (A) POPC (light shaded) and Chol (dark shaded) pack only loosely, because the β-side of Chol has two protruding methyl groups in the upper part of the molecule. The resulting free space in the hydrophobic region of the bilayer is easily filled by trans-gauche isomerization at the point of the double bond in the monounsaturated fatty acyl chain (B).

Similar articles

Cited by

References

    1. Ohvo-Reikila, H., B. Ramstedt, P. Leppimaki, and J. P. Slotte. 2002. Cholesterol interactions with phospholipids in membranes. Prog. Lipid Res. 41:66–97. - PubMed
    1. Yeagle, P. L. 1985. Cholesterol and cell membranes. Biochim. Biophys. Acta. 822:267–287. - PubMed
    1. Barenholz, Y. 2002. Cholesterol and other membrane active sterols: from membrane evolution to “rafts”. Prog. Lipid Res. 41:1–5. - PubMed
    1. Brown, D. A., and E. London. 1998. Functions of lipid rafts in biological membranes. Annu. Rev. Cell Dev. Biol. 14:111–136. - PubMed
    1. Simons, K., and E. Ikonen. 1997. Functional rafts in cell membranes. Nature. 387:569–572. - PubMed

Publication types