. 2007 Aug 15;93(4):1151-62.
doi: 10.1529/biophysj.107.108795. Epub 2007 May 25.

A kinetic model of single and clustered IP3 receptors in the absence of Ca2+ feedback

Affiliations

A kinetic model of single and clustered IP3 receptors in the absence of Ca2+ feedback

Jianwei Shuai et al. Biophys J. .

Abstract

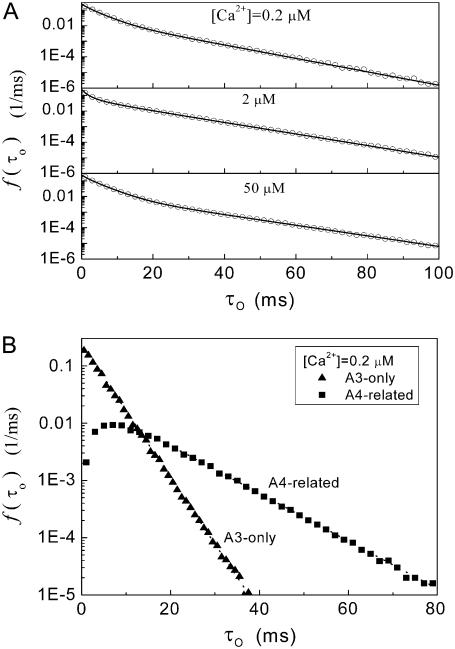
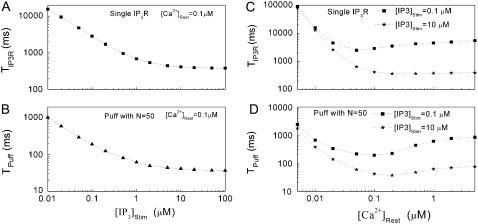
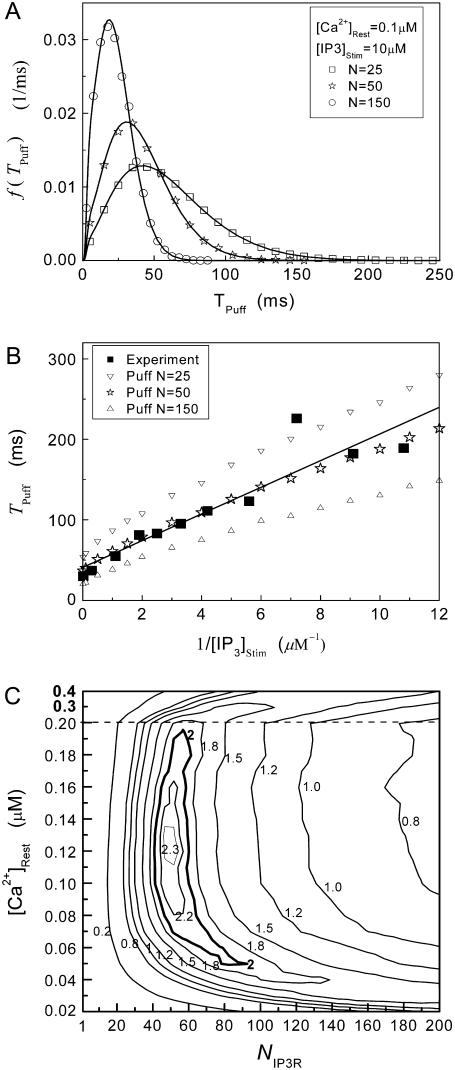
Ca2+ liberation through inositol 1,4,5-trisphosphate receptor (IP3R) channels generates complex patterns of spatiotemporal cellular Ca2+ signals owing to the biphasic modulation of channel gating by Ca2+ itself. These processes have been extensively studied in Xenopus oocytes, where imaging studies have revealed local Ca2+ signals ("puffs") arising from clusters of IP3R, and patch-clamp studies on isolated oocyte nuclei have yielded extensive data on IP3R gating kinetics. To bridge these two levels of experimental data, we developed an IP3R model and applied stochastic simulation and transition matrix theory to predict the behavior of individual and clustered IP3R channels. The channel model consists of four identical, independent subunits, each of which has an IP3-binding site together with one activating and one inactivating Ca2+-binding site. The channel opens when at least three subunits undergo a conformational change to an "active" state after binding IP3 and Ca2+. The model successfully reproduces patch-clamp data; including the dependence of open probability, mean open duration, and mean closed duration on [IP3] and [Ca2+]. Notably, the biexponential distribution of open-time duration and the dependence of mean open time on [Ca2+] are explained by populations of openings involving either three or four active subunits. As a first step toward applying the single IP3R model to describe cellular responses, we then simulated measurements of puff latency after step increases of [IP3]. Assuming that stochastic opening of a single IP3R at basal cytosolic [Ca2+] and any given [IP3] has a high probability of rapidly triggering neighboring channels by calcium-induced calcium release to evoke a puff, optimal correspondence with experimental data of puff latencies after photorelease of IP3 was obtained when the cluster contained a total of 40-70 IP3Rs.


Figures

FIGURE 1
FIGURE 1
Schematic diagram of the model of a single IP3R channel subunit. Each subunit has an activation Ca2+-binding site, an inhibitory Ca2+-binding site, and an IP3-binding site. We label the binding sites by the notation (ijk), where the index i represents the IP3-binding site, j the activation Ca2+-binding site, and k the inhibitory Ca2+-binding site. The number 1 represents an occupied binding site and 0 a nonoccupied site. Additionally we introduce a conformational change between “active” (A-state) and “inactive” (110) states of the subunit. Values for the forward (a) and backward (b) rate constants associated with each transition are listed in Table 1. In the figure, C and I represent the concentrations of Ca2+ and IP3, respectively. The bold arrows indicate the binding of ligands to different sites.
FIGURE 2
FIGURE 2
Stochastic and deterministic modeling of IP3R dynamics, and comparison with steady-state experimental data. (A) Example of stochastic simulation of IP3R channel gating (upper), and the corresponding numbers of subunits in the active state (lower) at [IP3] = 10 μM and [Ca2+] = 0.2 μM. Arrows mark openings that are associated with 4-related open states. (B) Graph shows the dependence of steady-state open probability (PO) as a function of [Ca2+] for different concentrations of IP3. Solid curves show results by the deterministic transition matrix theory. The results obtained by stochastic simulation are represented by open symbols ([IP3] = 10 μM (stars), 0.033 μM (circles), 0.02 μM (squares), and 0.01 μM (triangles)). Single-channel patch-clamp experimental data obtained from IP3R on native nuclear membranes by Mak et al. (10,11) were replotted as solid symbols ( [IP3] = 10 μM (stars); 0.033 μM (circles); 0.02 μM (squares); and 0.01 μM (triangles)). (C and D) Mean open time formula image (C) and closed time formula image (D), respectively, as functions of [Ca2+] for different concentrations of IP3, as indicated. Solid curves show results obtained with transition matrix theory, and open symbols show stochastic simulation results. Solid stars show corresponding experimental data at [IP3] = 10 μM (10,11).
FIGURE 3
FIGURE 3
Dependence of formula image on ligand concentration can be explained by a change in the proportion of openings involving only three active subunits (A3-only openings) and those involving four active subunits (A4-related openings). (A) Stochastic simulation results demonstrating that the mean open times of A3-only and A4-related openings show only a slight dependence on [Ca2+] for [IP3] = 10 μM. (B) The probabilities of A3-only and A4-related openings as functions of [Ca2+]. In both panels, [IP3] = 10 μM.
FIGURE 4
FIGURE 4
Distributions of open times predicted by the IP3R channel model. (A) Open-time distributions for basal Ca2+ concentrations at [Ca2+] = 0.2, 2, and 50 μM with [IP3] = 10 μM. Open symbols are results of stochastic simulations, and solid curves were obtained from the transition matrix theory. (B) Distributions of channel open durations involving A3-only and A4-related openings, derived from stochastic modeling at [Ca2+] = 0.2 μM and [IP3] = 10 μM.
FIGURE 5
FIGURE 5
Multicomponent closed-time distributions of the IP3R channel result in “burst-like” behavior. (A) Closed-time distributions at [Ca2+] = 0.2, 2.0, and 50 μM for [IP3] = 10 μM. Open symbols are stochastic simulations and solid curves are from the transition matrix theory. (B) Two examples of the fluctuation in average channel open probability within a 100-m-running window, respectively, for [Ca2+] = 0.1 and 100 μM and [IP3] = 10 μM.
FIGURE 6
FIGURE 6
Distributions of first-opening latencies for a single IP3R after different steps of [IP3] at various [Ca2+]. (A) Three examples are shown of stochastic simulations for a step of [IP3] from 0 to 10 μM (lower) with [Ca2+] = 0.1 μM. (B and C) Distributions of first-opening latencies after stepwise increases in [IP3] derived from stochastic modeling (open symbols) and theory (solid lines). Results are plotted for different magnitudes of formula image with [Ca2+] = 0.1 μM (B), and for different [Ca2+] with formula image = 10 μM (C).
FIGURE 7
FIGURE 7
Mean first-opening latencies for single and multiple IP3R after different steps of formula image at various [Ca2+]. (A and B) The mean first-opening latency of an individual IP3R channel (A) as a function of formula image with [Ca2+] = 0.1 μM, and the corresponding latencies for the first opening of any channel among a population of 50 IP3R channels (i.e., the predicted puff latency) (B). (C and D) Corresponding dependence of mean single-channel first-opening latency (C) and puff latency (D) for a cluster of 50 channels as a function of [Ca2+] for formula image (stars) and formula image (squares).
FIGURE 8
FIGURE 8
Simulation and experimental measurements of puff latencies. (A) Predicted latency distribution of puffs for formula image = 10 μM and formula image = 0.1 μM, assuming that a puff is evoked by the first opening of any IP3R channel within clusters containing N IP3Rs. The open symbols are for stochastic simulation results with formula image (inverted triangles), 50 (stars), or 150 (triangles). The corresponding solid curves are obtained from the transition matrix theory. (B) Predicted mean puff latencies as functions of formula image are shown for clusters containing formula image (inverted triangles), 50 (stars), and 150 (triangles) channels, with formula image = 0.1 μM. For comparison, experimental data of puff latencies as a function of [IP3] step is replotted as solid squares from Callamaras et al. (7) and Parker et al. (8) after normalizing as described in the text. (C) Goodness of fit of stochastic simulations to the experimental data as functions of both the number of IP3R in a cluster and the resting Ca2+ concentration. Optimal agreement (maximal value of the index formula image) is obtained with N ≈ 40–70 and formula image ≈ 0.05–0.2 μM.

Similar articles

Cited by

References

    1. Foskett, J. K., C. White, K. Cheung, and D. D. Mak. 2007. Inositol trisphosphate receptor Ca2+ release channels. Physiol. Rev. 87:593–658. - PMC - PubMed
    1. Taylor, C. W., P. C. da Fonseca, and E. P. Morris. 2004. IP3 receptors: the search for structure. Trends Biochem. Sci. 29:210–219. - PubMed
    1. Bosanac, I., J. R. Alattia, T. K. Mal, J. Chan, S. Talarico, F. K. Tong, K. I. Tong, F. Yoshikawa, T. Furuichi, M. Iwai, T. Michikawa, K. Mikoshiba, and M. Ikura. 2002. Structure of the inositol 1,4,5-trisphosphate receptor binding core in complex with its ligand. Nature. 420:696–700. - PubMed
    1. Bezprozvanny, I. 2005. The inositol 1,4,5-trisphosphate receptors. Cell Calcium. 38:261–272. - PubMed
    1. Bezprozvanny, I., J. Watras, and B. E. Ehrlich. 1991. Bell-shaped calcium-response curves of Ins(1,4,5)P3- and calcium-gated channels from endoplasmic reticulum of cerebellum. Nature. 351:751–754. - PubMed

Publication types