. 2007 Sep 15;93(6):1938-49.
doi: 10.1529/biophysj.107.110148. Epub 2007 May 25.

Models of beta-amyloid ion channels in the membrane suggest that channel formation in the bilayer is a dynamic process

Affiliations

Models of beta-amyloid ion channels in the membrane suggest that channel formation in the bilayer is a dynamic process

Hyunbum Jang et al. Biophys J. .

Abstract

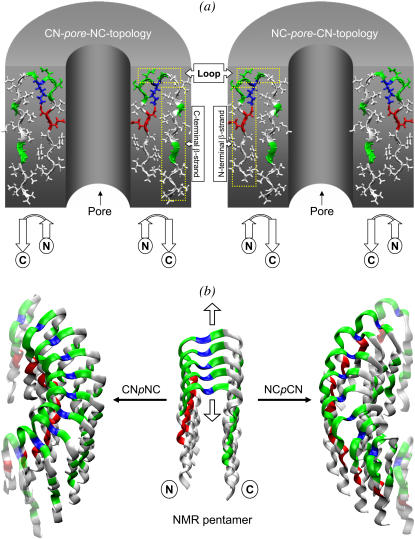
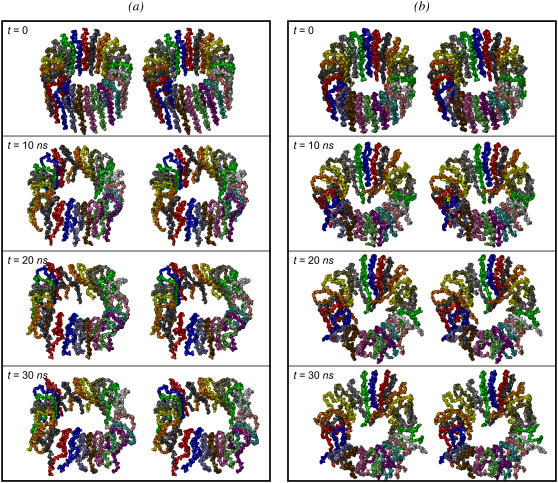
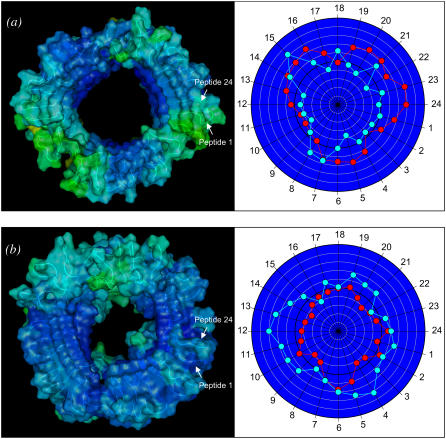
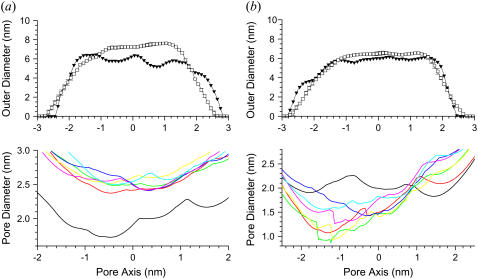
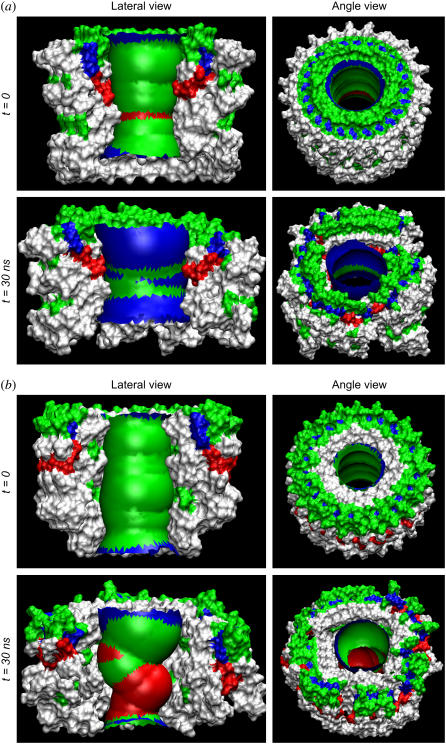
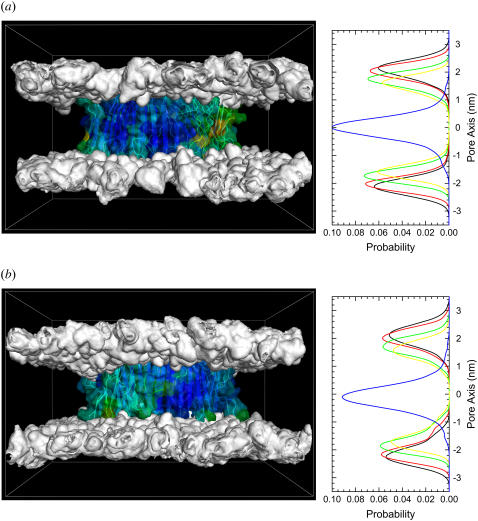
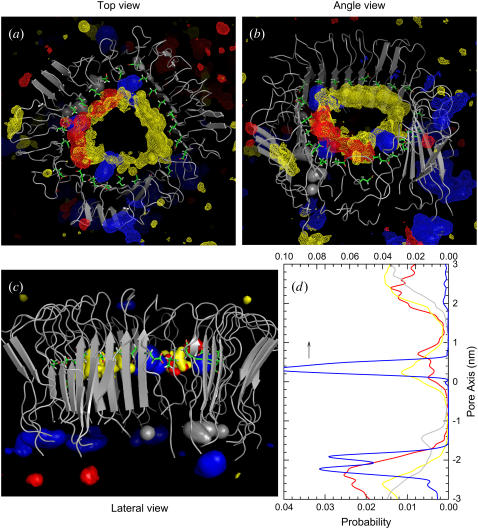
Here we model the Alzheimer beta-peptide ion channel with the goal of obtaining insight into the mechanism of amyloid toxicity. The models are built based on NMR data of the oligomers, with the universal U-shaped (strand-turn-strand) motif. After 30-ns simulations in the bilayer, the channel dimensions, shapes and subunit organization are in good agreement with atomic force microscopy (AFM). The models use the Abeta(17-42) pentamer NMR-based coordinates. Extension and bending of the straight oligomers lead to two channel topologies, depending on the direction of the curvature: 1), the polar/charged N-terminal beta-strand of Abeta(17-42) faces the water-filled pore, and the hydrophobic C-terminal beta-strand faces the bilayer (CNpNC; p for pore); and 2), the C-terminal beta-strand faces the solvated pore (NCpCN). In the atomistic simulations in a fully solvated DOPC lipid bilayer, the first (CNpNC) channel preserves the pore and conducts solvent; by contrast, hydrophobic collapse blocks the NCpCN channel. AFM demonstrated open pores and collapsed complexes. The final averaged CNpNC pore dimensions (outer diameter 8 nm; inner diameter approximately 2.5 nm) are in the AFM range (8-12 nm; approximately 2 nm, respectively). Further, in agreement with high-resolution AFM images, during the simulations, the channels spontaneously break into ordered subunits in the bilayer; however, we also observe that the subunits are loosely connected by partially disordered inner beta-sheet, suggesting subunit mobility in the bilayer. The cationic channel has strong selective affinity for Ca(2+), supporting experimental calcium-selective beta-amyloid channels. Membrane permeability and consequent disruption of calcium homeostasis were implicated in cellular degeneration. Consequently, the CNpNC channel topology can sign cell death, offering insight into amyloid toxicity via an ion "trap-release" transport mechanism. The observed loosely connected subunit organization suggests that amyloid channel formation in the bilayer is a dynamic, fluid process involving subunit association, dissociation, and channel rearrangements.


Figures

FIGURE 1
FIGURE 1
(a) Topologies of the CNpNC (left) and NCpCN (right) Aβ17–42 channels; the coordinates of the monomers are taken from the NMR pentamer structure in the PDB (id: 2BEG). The monomer has a U-shaped conformation (strand-turn-strand). The initial annular channel topologies are shown as a cross section of a hollowed cylinder in gray with a cut along the pore axis. The Aβ17–42 peptide in a ribbon representation is projected into the cross-section area. The topology of each peptide is drawn by connected white arrows with C and N denoting the C- and N-termini, respectively. Different peptide orientations in the channels reflect the different channel topologies. The topology on the left is the toxic, ion-permeable, and Ca2+ selective amyloid channel. (b) The NMR pentamer (center) shown by the peptide backbones in ribbon representations. Two different directions of curvature yield the CNpNC (left) and NCpCN (right) channels. The up/down arrows from the pentamer indicate the direction of fibril growth. In the peptides, hydrophobic residues are shown in white, two polar (Ser26 and Asn27) and five Gly (25, 29, 33, 37, and 38) residues are shown in green, a positively charged residue (Lys28) is shown in blue, and two negatively charged residues (Glu22 and Asp23) are shown in red.
FIGURE 2
FIGURE 2
Snapshots of Aβ17–42 channels in the DOPC bilayer taken at simulation times of t = 0, 10, 20, and 30 ns for the (a) CNpNC and (b) NCpCN Aβ17–42 channels (see Fig. 1 for the topology). The cartoons representing the peptide backbone are in stereo view, and each peptide backbone in the cartoons is in a different color.
FIGURE 3
FIGURE 3
Channel structures averaged over the simulation in a ribbon representation with a transparent surface are shown in the left panels. All channels are viewed from top leaflet of the lipid bilayer and colored according to the B-factor (or temperature factor, see text). The first and last peptides (peptides 1 and 24) of the annular channel are marked. The right panels illustrate the β-strand order parameters for the N-terminal and C-terminal β-strands for the (a) CNpNC and (b) NCpCN Aβ17–42 channel topologies (see Fig. 1). Red circles denote the order parameter for the N-terminal β-strand, whereas cyan circles denote the order parameter for the C-terminal β-strand of each peptide in the channels.
FIGURE 4
FIGURE 4
Averaged outer channel diameter (open symbols at upper panels) and pore diameter (solid lines at lower panels) as a function of the distance along the pore center axis for the (a) CNpNC and (b) NCpCN Aβ17–42 channels. A black line with solid symbols in the outer diameter and a black solid line in the pore diameter represent the initial channel dimension at the starting points. The pore diameters are measured at selected simulation times of t = 5 (red lines), 10 (green lines), 15 (yellow lines), 20 (blue lines), 25 (pink lines), and 30 (cyan lines) ns.
FIGURE 5
FIGURE 5
Pore structures calculated by the HOLE program (49) at t = 0 and 30 ns for the (a) CNpNC and (b) NCpCN Aβ17–42 channels. For the pore structures in the surface representation, red denotes pore radius of r < 0.9 nm, green denotes pore radius in the range, 0.9 nm ≤ r ≤ 1.3 nm, and blue denotes pore radius of r > 1.3 nm. In the surface representation for the channels, the front part of the channels in the lateral view has been removed to allow a view of the pore. In the channel structures, hydrophobic residues are shown in white, two polar (Ser26 and Asn27) and five Gly (25, 29, 33, 37, and 38) residues are shown in green, a positively charged residue (Lys28) is shown in blue, and two negatively charged residues (Glu22 and Asp23) are shown in red.
FIGURE 6
FIGURE 6
Three-dimensional density maps (left panels) of the lipid headgroup of the DOPC bilayer (white surface) and probability distribution functions (P) (right panels) for different component groups of lipid (PChol (choline, black lines), PPO4 (phosphate, red lines), PGlyc (glycerol, green lines), PCarb (carbonyls, yellow lines), and PCH3 (methyl, blue lines)) as a function of the distance along the pore center axis for the (a) CNpNC and (b) NCpCN Aβ17–42 channels. The density maps represent the lateral view of the time-averaged bilayer structure. The Aβ17–42 channels in a surface representation with the B-factor coloring (see Fig. 3) are embedded in the density maps.
FIGURE 7
FIGURE 7
Deuterium order parameters, SCD, for the lipid chains at the top leaflet (open symbols) and at the bottom leaflet (solid symbols) of the lipid bilayer composed of DOPC for the (a) CNpNC and (b) NCpCN Aβ17–42 channels.
FIGURE 8
FIGURE 8
Three-dimensional density map of Ca2+ (blue surface and mesh), K+ (red surface and mesh), Na+ (yellow surface and mesh), and Cl (gray surface) for the CNpNC Aβ17–42 channel in the (a) top, (b) angle, and (c) lateral views. The averaged channel structure is shown as cartoons in gray. (d) Probability distribution functions for Ca2+ (blue line), K+ (red line), Na+ (yellow line), and Cl (gray line) as a function of the distance along the pore center axis. The Ca2+ trapped at the negatively charged Glu22 side chain enter from the top channel gate in the top lipid bilayer leaflet, whereas the Ca2+ near the bottom channel gate are trapped by the carboxyl termini.
FIGURE 9
FIGURE 9
Time series of the charged state in the pore of the CNpNC Aβ17–42 channel for Ca2+ (blue line), K+ (red line), Na+ (yellow line), Cl (gray line), and total charges (black). The number of charges are counted in the pore with a cutoff, −1.5 nm < z < 1.5 nm, from the bilayer center along the pore axis.

References

    1. Selkoe, D. J. 1991. Alzheimer's disease. In the beginning. Nature. 354:432–433. - PubMed
    1. Kirkitadze, M. D., G. Bitan, and D. B. Teplow. 2002. Paradigm shifts in Alzheimer's disease and other neurodegenerative disorders: the emerging role of oligomeric assemblies. J. Neurosci. Res. 69:567–577. - PubMed
    1. Bucciantini, M., E. Giannoni, F. Chiti, F. Baroni, L. Formigli, J. Zurdo, N. Taddei, G. Ramponi, C. M. Dobson, and M. Stefani. 2002. Inherent toxicity of aggregates implies a common mechanism for protein misfolding diseases. Nature. 416:507–511. - PubMed
    1. Walsh, D. M., I. Klyubin, J. V. Fadeeva, W. K. Cullen, R. Anwyl, M. S. Wolfe, M. J. Rowan, and D. J. Selkoe. 2002. Naturally secreted oligomers of amyloid β protein potently inhibit hippocampal long-term potentiation in vivo. Nature. 416:535–539. - PubMed
    1. Lin, H., Y. J. Zhu, and R. Lal. 1999. Amyloid β protein (1–40) forms calcium-permeable, Zn2+-sensitive channel in reconstituted lipid vesicles. Biochemistry. 38:11189–11196. - PubMed

Publication types

LinkOut - more resources