Quantitative characterization of intrinsic disorder in polyglutamine: insights from analysis based on polymer theories
- PMID: 17526581
- PMCID: PMC1959550
- DOI: 10.1529/biophysj.107.110080
Quantitative characterization of intrinsic disorder in polyglutamine: insights from analysis based on polymer theories
Abstract
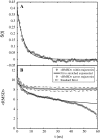
Intrinsically disordered proteins (IDPs) are unfolded under physiological conditions. Here we ask if archetypal IDPs in aqueous milieus are best described as swollen disordered coils in a good solvent or collapsed disordered globules in a poor solvent. To answer this question, we analyzed data from molecular simulations for a 20-residue polyglutamine peptide and concluded, in accord with experimental results, that water is a poor solvent for this system. The relevance of monomeric polyglutamine is twofold: It is an archetypal IDP sequence and its aggregation is associated with nine neurodegenerative diseases. The main advance in this work lies in our ability to make accurate assessments of solvent quality from analysis of simulations for a single, rather than multiple chain lengths. We achieved this through the proper design of simulations and analysis of order parameters that are used to describe conformational equilibria in polymer physics theories. Despite the preference for collapsed structures, we find that polyglutamine is disordered because a heterogeneous ensemble of conformations of equivalent compactness is populated at equilibrium. It is surprising that water is a poor solvent for polar polyglutamine and the question is: why? Our preliminary analysis suggests that intrabackbone interactions provide at least part of the driving force for the collapse of polyglutamine in water. We also show that dynamics for conversion between distinct conformations resemble structural relaxation in disordered, glassy systems, i.e., the energy landscape for monomeric polyglutamine is rugged. We end by discussing generalizations of our methods to quantitative studies of conformational equilibria of other low-complexity IDP sequences.
Figures


Similar articles
-
Role of backbone-solvent interactions in determining conformational equilibria of intrinsically disordered proteins.J Am Chem Soc. 2008 Jun 11;130(23):7380-92. doi: 10.1021/ja710446s. Epub 2008 May 16. J Am Chem Soc. 2008. PMID: 18481860
-
Atomistic simulations of the effects of polyglutamine chain length and solvent quality on conformational equilibria and spontaneous homodimerization.J Mol Biol. 2008 Dec 5;384(1):279-97. doi: 10.1016/j.jmb.2008.09.026. Epub 2008 Sep 18. J Mol Biol. 2008. PMID: 18824003 Free PMC article.
-
Characterizing the conformational ensemble of monomeric polyglutamine.Proteins. 2006 May 1;63(2):297-311. doi: 10.1002/prot.20761. Proteins. 2006. PMID: 16299774
-
Biophysical Methods to Investigate Intrinsically Disordered Proteins: Avoiding an "Elephant and Blind Men" Situation.Adv Exp Med Biol. 2015;870:215-60. doi: 10.1007/978-3-319-20164-1_7. Adv Exp Med Biol. 2015. PMID: 26387104 Review.
-
Towards the physical basis of how intrinsic disorder mediates protein function.Arch Biochem Biophys. 2012 Aug 15;524(2):123-31. doi: 10.1016/j.abb.2012.04.024. Epub 2012 May 9. Arch Biochem Biophys. 2012. PMID: 22579883 Review.
Cited by
-
Dynamical phase transitions reveal amyloid-like states on protein folding landscapes.Biophys J. 2014 Aug 19;107(4):974-82. doi: 10.1016/j.bpj.2014.06.046. Biophys J. 2014. PMID: 25140433 Free PMC article.
-
An Analysis of Biomolecular Force Fields for Simulations of Polyglutamine in Solution.Biophys J. 2015 Sep 1;109(5):1009-18. doi: 10.1016/j.bpj.2015.07.018. Biophys J. 2015. PMID: 26331258 Free PMC article.
-
The unfoldomics decade: an update on intrinsically disordered proteins.BMC Genomics. 2008 Sep 16;9 Suppl 2(Suppl 2):S1. doi: 10.1186/1471-2164-9-S2-S1. BMC Genomics. 2008. PMID: 18831774 Free PMC article.
-
Biophysical characterization of intrinsically disordered proteins.Curr Opin Struct Biol. 2009 Feb;19(1):23-30. doi: 10.1016/j.sbi.2008.12.004. Epub 2009 Jan 21. Curr Opin Struct Biol. 2009. PMID: 19162471 Free PMC article. Review.
-
Are long-range structural correlations behind the aggregration phenomena of polyglutamine diseases?PLoS Comput Biol. 2012;8(4):e1002501. doi: 10.1371/journal.pcbi.1002501. Epub 2012 Apr 26. PLoS Comput Biol. 2012. PMID: 22577357 Free PMC article.
References
-
- Dunker, A. K., C. J. Brown, and Z. Obradovic. 2002. Identification and functions of usefully disordered proteins. Adv. Protein Chem. 62:25–49. - PubMed
-
- Dunker, A. K., C. J. Brown, J. D. Lawson, L. M. Iakoucheva, and Z. Obradovic. 2002. Intrinsic disorder and protein function. Biochemistry. 41:6573–6582. - PubMed
-
- Dyson, H. J., and P. E. Wright. 2005. Intrinsically unstructured proteins and their functions. Nat. Rev. Mol. Cell Biol. 6:197–208. - PubMed
-
- Weathers, E. A., M. E. Paulaitis, T. B. Woolf, and J. H. Hoh. 2004. Reduced amino acid alphabet is sufficient to accurately recognize intrinsically disordered protein. FEBS Lett. 576:348–352. - PubMed
MeSH terms
Substances
LinkOut - more resources
Full Text Sources

