. 2007 Sep 15;93(6):2110-7.
doi: 10.1529/biophysj.107.109439. Epub 2007 May 25.

Nanometer distance measurements in RNA using site-directed spin labeling

Affiliations

Nanometer distance measurements in RNA using site-directed spin labeling

Qi Cai et al. Biophys J. .

Abstract

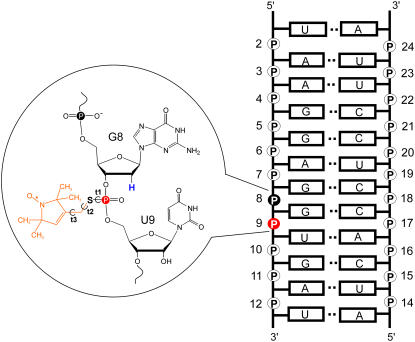
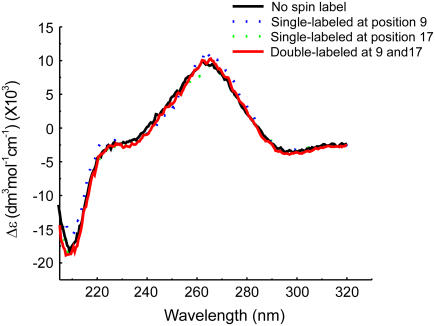
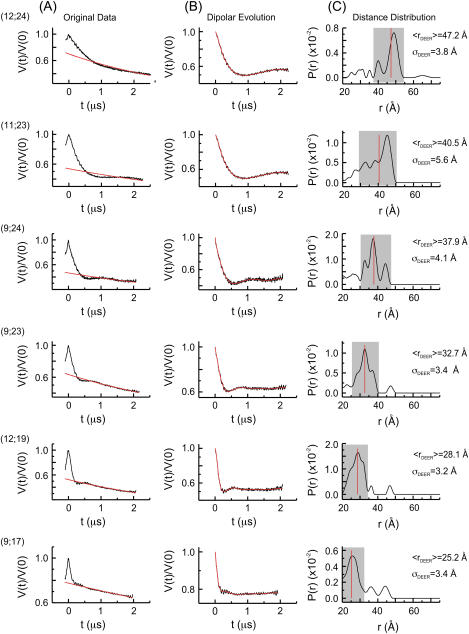
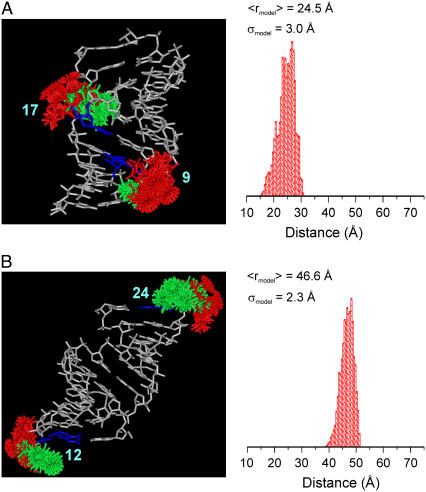
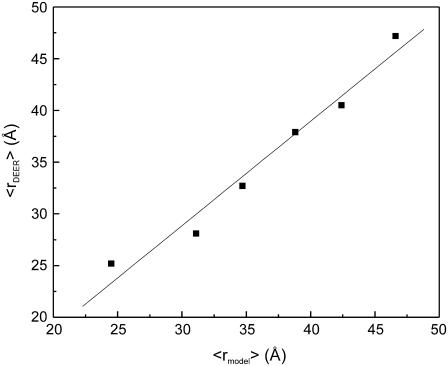
The method of site-directed spin labeling (SDSL) utilizes a stable nitroxide radical to obtain structural and dynamic information on biomolecules. Measuring dipolar interactions between pairs of nitroxides yields internitroxide distances, from which quantitative structural information can be derived. This study evaluates SDSL distance measurements in RNA using a nitroxide probe, designated as R5, which is attached in an efficient and cost-effective manner to backbone phosphorothioate sites that are chemically substituted in arbitrary sequences. It is shown that R5 does not perturb the global structure of the A-form RNA helix. Six sets of internitroxide distances, ranging from 20 to 50 A, were measured on an RNA duplex with a known X-ray crystal structure. The measured distances strongly correlate (R(2) = 0.97) with those predicted using an efficient algorithm for determining the expected internitroxide distances from the parent RNA structure. The results enable future studies of global RNA structures for which high-resolution structural data are absent.


Figures

FIGURE 1
FIGURE 1
Model SDR RNA. The RNA sequence is shown on the right, with the phosphate positions numbered. By convention each phosphate “belongs” to the ribose that is on the 3′-side of the P atom. The inset shows the detailed chemical structure of an R5 (orange) attached at position 9. Notice the deoxyribose substitution at nucleotide 8, which replaces the 2′-OH group adjacent to the labeled phosphorothioate with a 2′-H (blue).
FIGURE 2
FIGURE 2
Representative set of CD spectra of R5-labeled SDR RNA duplexes. The “no spin label” spectrum is obtained from an all-ribose SDR duplex without any phosphorothioate or deoxyribose modification. For spectra of labeled SDR duplexes, the positions of R5 are indicated in parentheses.
FIGURE 3
FIGURE 3
DEER data. The positions of R5 are shown in parentheses. (A) Original echo decay data. The black traces are the measured echo amplitude that has been normalized to the amplitude at t = 0. The red traces are the background echo decay computed using a homogeneous three-dimensional spin distribution. (B) Dipolar evolution functions. The black traces represent the differences between the measured echo decay and the background decay shown in A. The red traces are the simulated echo decay computed according to the corresponding distance distributions shown in C. (C) The distance distributions (P(r)), which were computed with a regularization parameter of 10. Varying the regularization parameter from 1 to 100 did not significantly change the computed P(r). The major band in each P(r), defined as those distances with P(r) ≥ (0.25 × Pmax), is marked by a shaded box. The red lines mark the average distances calculated for each major band.
FIGURE 4
FIGURE 4
Ensembles of allowable R5 conformations modeled at sites (9;17) (A) and sites (12;24) (B) of the SDR RNA. The RNA is shown in white, with the labeled nucleotides shown in blue. Conformers attached to the Sp diastereomer are shown in red, and those attached to the Rp diastereomer are in green. On the right is a histogram of the predicted distance distribution, with the average distance (〈rmodel〉) and width of the distribution (σmodel) shown.
FIGURE 5
FIGURE 5
Correlation between the measured (〈rDEER〉) and predicted (〈rmodel〉) average distances. The solid line represents a linear fit of 〈rDEER〉 = 1.0 × 〈rmodel〉 − 1.4 Å.

Similar articles

Cited by

References

    1. Gesteland, R. F., J. F. Atkins, and T. R. Cech, editors. 2006. RNA World, 3rd ed. Cold Spring Harbor, New York: Cold Spring Harbor Laboratory Press.
    1. Moore, P. B., and T. A. Steitz. 2005. The ribosome revealed. Trends Biochem. Sci. 30:281–283. - PubMed
    1. Hubbell, W. L., A. Gross, R. Langen, and M. A. Leitzow. 1998. Recent advances in site-directed spin labeling of proteins. Curr. Opin. Struct. Biol. 8:649–656. - PubMed
    1. Feix, J. B., and C. S. Klug. 1998. Site-directed spin labeling of membrane proteins and peptide-membrane interactions. In Biological Magnetic Resonance. L. J. Berliner, editor. Plenum Press, New York. 251–281.
    1. Hubbell, W. L., D. S. Cafiso, and C. Altenbach. 2000. Identifying conformational changes with site-directed spin labeling. Nat. Struct. Biol. 7:735–739. - PubMed

Publication types