. 2007 Aug 15;93(4):1338-46.
doi: 10.1529/biophysj.107.106864. Epub 2007 May 25.

Detection and correction of blinking bias in image correlation transport measurements of quantum dot tagged macromolecules

Affiliations

Detection and correction of blinking bias in image correlation transport measurements of quantum dot tagged macromolecules

Nela Durisic et al. Biophys J. .

Abstract

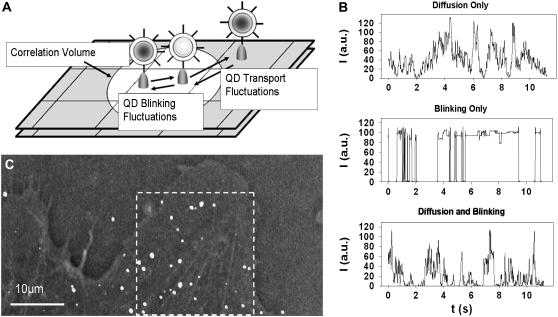
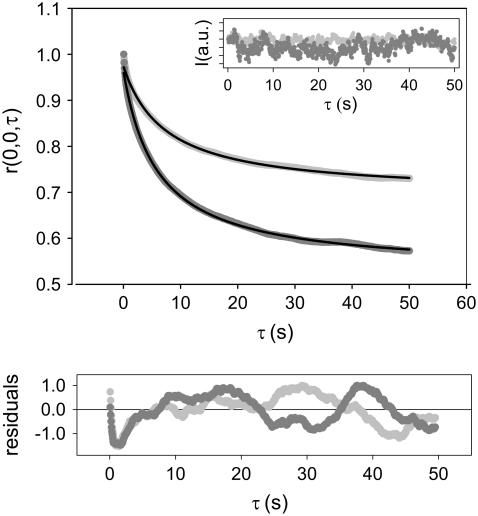
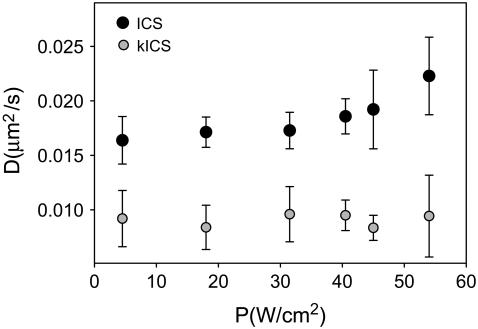
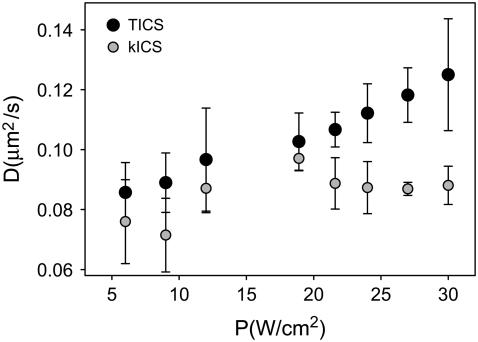
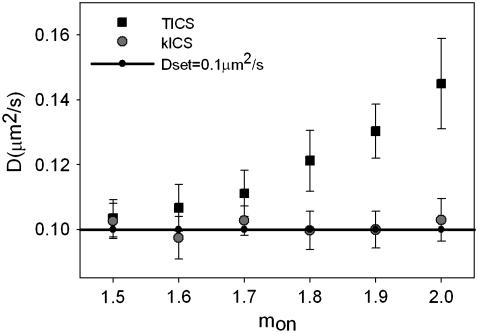
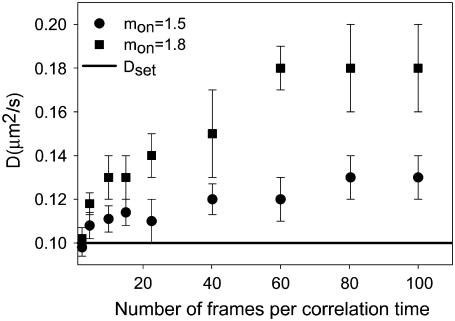
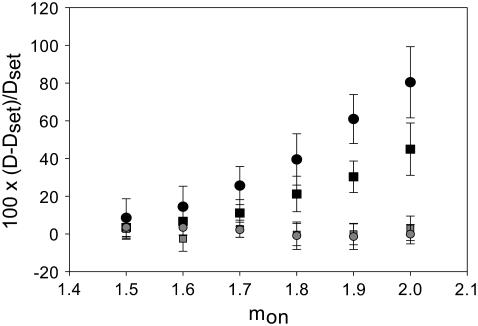
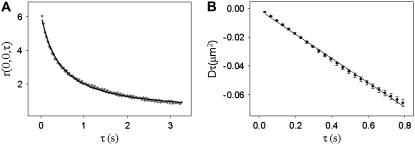
Semiconductor nanocrystals or quantum dots (QDs) are becoming widely used as fluorescent labels for biological applications. Here we demonstrate that fluorescence fluctuation analysis of their diffusional mobility using temporal image correlation spectroscopy is highly susceptible to systematic errors caused by fluorescence blinking of the nanoparticles. Temporal correlation analysis of fluorescence microscopy image time series of streptavidin-functionalized (CdSe)ZnS QDs freely diffusing in two dimensions shows that the correlation functions are fit well to a commonly used diffusion decay model, but the transport coefficients can have significant systematic errors in the measurements due to blinking. Image correlation measurements of the diffusing QD samples measured at different laser excitation powers and analysis of computer simulated image time series verified that the effect we observe is caused by fluorescence intermittency. We show that reciprocal space image correlation analysis can be used for mobility measurements in the presence of blinking emission because it separates the contributions of fluctuations due to photophysics from those due to transport. We also demonstrate application of the image correlation methods for measurement of the diffusion coefficient of glycosyl phosphatidylinositol-anchored proteins tagged with QDs as imaged on living fibroblasts.


Figures

FIGURE 1
FIGURE 1
(A) Schematic representation of the correlation volume on an area detector. Fluorescent fluctuations due to QD mobility cannot be distinguished from blinking since they both result in a change in the signal level from the correlation volume. (B) Intensity time traces of a single pixel from three different simulations: in the first simulation, fluorescent particles were diffusing in two dimensions but blinking was absent; in the second, particles with power law blinking were immobilized; and in the third simulation, fluorescent particles were diffusing and blinking. All simulations contained 500 images, each with an image area of 128 × 128 pixels and temporal sampling of 10 frames/s. The diffusion coefficient was set to 0.1 μm2/s and the PDF blinking exponent was mon = 1.5. (C) Superimposed differential interference contrast and fluorescence image of CD73 protein labeled with QDs in the basal membrane of a fibroblast. The subregion analyzed is outlined in white. It contained 1798 images collected at the video rate.
FIGURE 2
FIGURE 2
Typical normalized intensity time correlation functions for two different excitation powers calculated from the same sample of QDs diffusing and blinking. Excitation laser powers are 4.5 W/cm2 (light shaded) and 13.5 W/cm2 (shaded). Correlation functions and the average fluorescent intensity per frame in the image stack (inset) are normalized to 1 for comparison. A fit to 2D-diffusion model is shown in black with residuals for both fits below the plot. Average fluorescence intensity per frame changes from 0.92 to 1.04 and does not decay in time. Each image stack contained 2000 images with 63 ms time resolution.
FIGURE 3
FIGURE 3
Plot of the diffusion coefficient as a function of laser power obtained from the sample that contained a static population of QDs. Diffusion coefficients calculated from TICS analysis (solid circles) and from kICS (shaded circles). The 2D diffusion model (Eq. 3) is used to fit TICS correlation functions. Each point is an average of six measurements. Error bars are the standard deviation.
FIGURE 4
FIGURE 4
Plot of the diffusion coefficient as a function of laser power obtained from TICS analysis for a sample that did not contain a static population of QDs (solid circles) when a simple 2D diffusion model is used to fit correlation functions. Diffusion coefficients calculated using kICS analysis are not affected by blinking (shaded circles). Each value is an average of four measurements performed on the same sample. Error bars are standard deviations.
FIGURE 5
FIGURE 5
Diffusion coefficients calculated from TICS analysis of combined blinking and diffusion simulations of point emitters with varying “on” time PDF exponents and an “off” time PDF exponent set to 1.5 (solid squares). kICS results do not change with “on” time PDF exponent (shaded circles). Parameters in simulations were set to mimic experimental conditions in model systems that did not contain a static population of QDs. Each image time series was 2000-frames long, with an area of 64 × 64 pixels, time lag of 60 ms between images, and ∼250 QDs per frame. The diffusion coefficient was set to 10 × 10−2 μm2/s. Each value is an average from 20 simulations. Error bars are standard deviations.
FIGURE 6
FIGURE 6
Plot of the recovered diffusion coefficient from simulated blinking and diffusing point emitters as a function of the number of frames per characteristic diffusion time when the 2D diffusion model is used to fit TICS data. The diffusion coefficient was set to 0.1 μm2/s. “On” time PDF exponents are set to 1.5 (circles) and 1.8 (squares). Error bars are standard deviation calculated from 20 simulations. The image series simulations contained 500 images, each with an image area of 128 × 128 pixels and ∼900 particles per frame.
FIGURE 7
FIGURE 7
Plot of the relative error for recovered diffusion constants from TICS analysis of simulated point emitters blinking and diffusing in two dimensions as a function of “on” time PDF exponent for temporal sampling of 13 frames/τd (solid circles) and 130 frames/τd (solid circles). kICS results (solid squares and circles) are insensitive to the blinking regime and temporal sampling. In all simulations Dset = 0.1 μm2/s. Error bars are mean ± SD from 20 simulations. The simulations contained 2000 images, each with an image area of 64 × 64 pixels and 250 particles.
FIGURE 8
FIGURE 8
(A) Experimental temporal autocorrelation function calculated for the 213 × 235 pixels cell region highlighted in Fig. 1 (shaded circles). Solid line is a fit to 2D-diffusion model (Eq. 3). Image time series contained 1798 frames with the time step of 33 ms. The precision of the measurement was calculated using Kolin et al. (19). (B) Result obtained from kICS analysis. Every point is a slope recovered from Eq. 7 at each time lag τ, −, plotted as a function of τ for a subregion of the cell outlined in white in Fig. 1 C. The slope of this plot is −DkICS. The error bars are the error of the corresponding linear regressions.

Similar articles

Cited by

References

    1. Bruchez, M. Jr., M. Moronne, P. Gin, S. Weiss, and A. P. Alivisatos. 1998. Semiconductor nanocrystals as fluorescent biological labels. Science. 281:2013–2016. - PubMed
    1. Alivisatos, P. 2004. The use of nanocrystals in biological detection. Nat. Biotechnol. 22:47–52. - PubMed
    1. Wu, X. Y., J. H. Liu, Q. J. Liu, N. K. Haley, A. J. Treadway, P. J. Larson, F. N. Ge, F. Peale, and P. M. Bruchez. 2002. Immunofluorescent labeling of cancer marker Her2 and other cellular targets with semiconductor quantum dots. Nat. Biotechnol. 21:41–46. - PubMed
    1. Pellegrino, T., L. Manna, S. Kudera, T. Liedl, D. Koktysh, L. A. Rogach, S. Keller, J. Rädler, G. Natile, and W. J. Parak. 2004. Hydrophobic nanocrystals coated with an amphiphilic polymer shell: a general route to water soluble nanocrystals. Nano Lett. 4:703–707.
    1. Gao, X., Y. Cui, M. R. Levenson, K. W. L. Chung, and S. Nie. 2004. In vivo cancer targeting and imaging with semiconductor quantum dots. Nat. Biotechnol. 22:969–976. - PubMed

Publication types

LinkOut - more resources