. 2007 Aug 15;93(4):1293-311.
doi: 10.1529/biophysj.106.096867. Epub 2007 May 25.

Mixing of exciton and charge-transfer states in Photosystem II reaction centers: modeling of Stark spectra with modified Redfield theory

Affiliations

Mixing of exciton and charge-transfer states in Photosystem II reaction centers: modeling of Stark spectra with modified Redfield theory

Vladimir I Novoderezhkin et al. Biophys J. .

Abstract

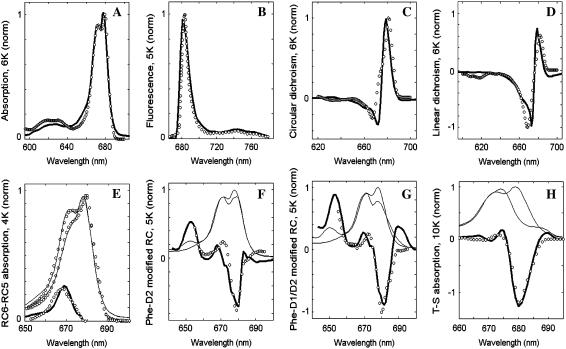
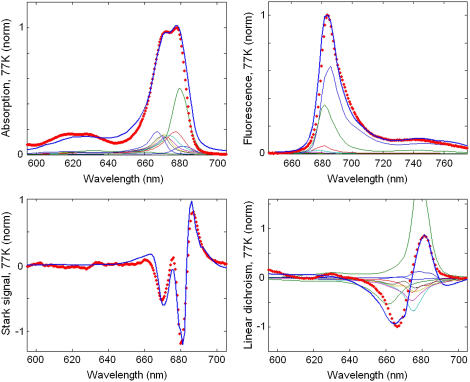
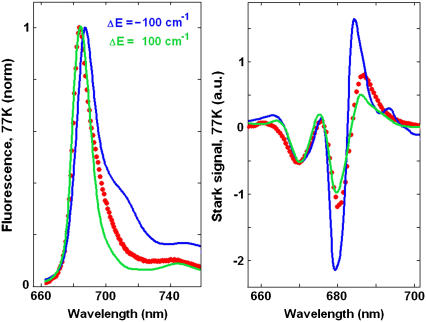
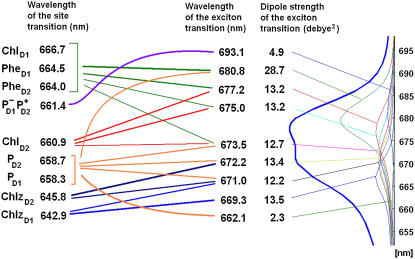
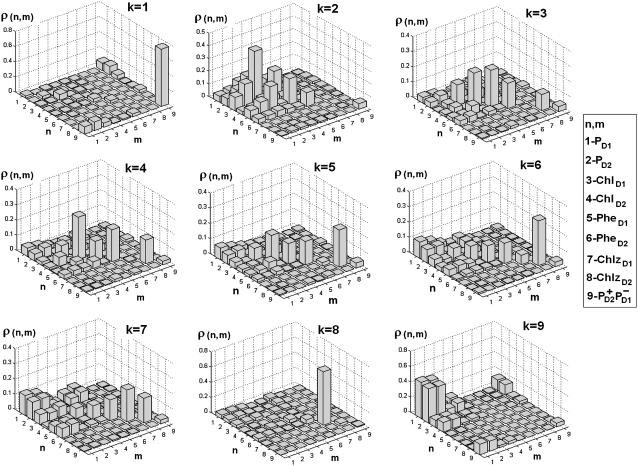
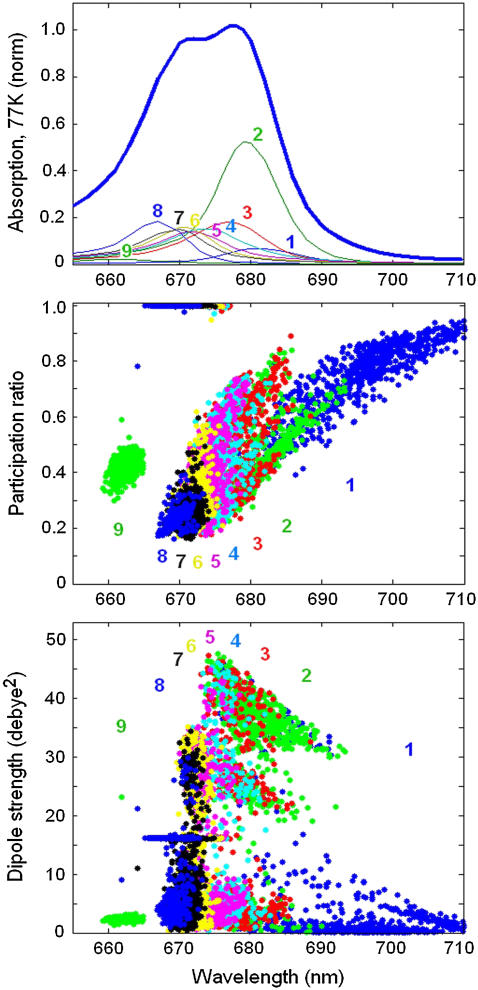
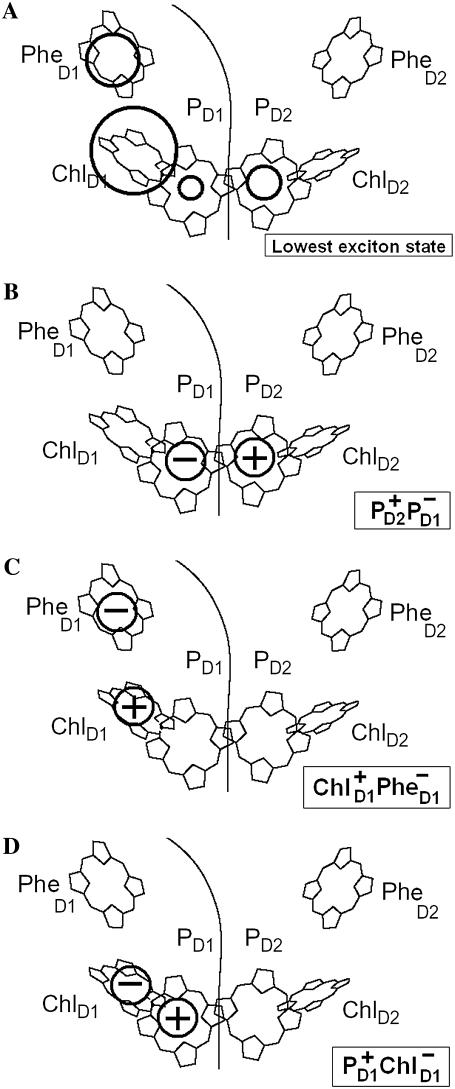
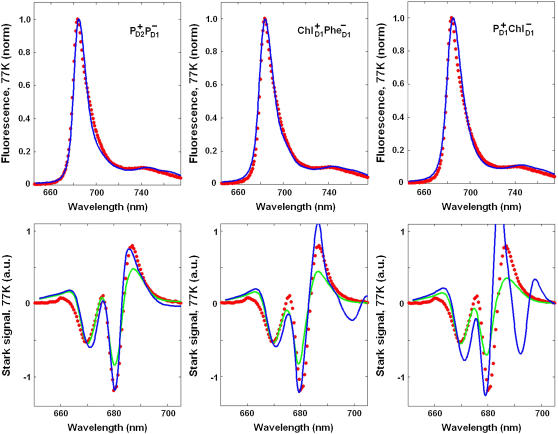
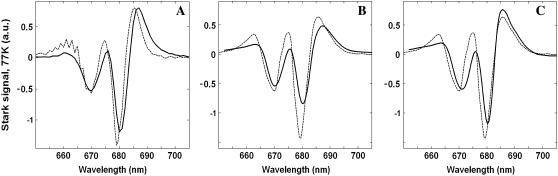
We propose an exciton model for the Photosystem II reaction center (RC) based on a quantitative simultaneous fit of the absorption, linear dichroism, circular dichroism, steady-state fluorescence, triplet-minus-singlet, and Stark spectra together with the spectra of pheophytin-modified RCs, and so-called RC5 complexes that lack one of the peripheral chlorophylls. In this model, the excited state manifold includes a primary charge-transfer (CT) state that is supposed to be strongly mixed with the pure exciton states. We generalize the exciton theory of Stark spectra by 1), taking into account the coupling to a CT state (whose static dipole cannot be treated as a small parameter in contrast to usual excited states); and 2), expressing the line shape functions in terms of the modified Redfield approach (the same as used for modeling of the linear responses). This allows a consistent modeling of the whole set of experimental data using a unified physical picture. We show that the fluorescence and Stark spectra are extremely sensitive to the assignment of the primary CT state, its energy, and coupling to the excited states. The best fit of the data is obtained supposing that the initial charge separation occurs within the special-pair PD1PD2. Additionally, the scheme with primary electron transfer from the accessory chlorophyll to pheophytin gave a reasonable quantitative fit. We show that the effectiveness of these two pathways is strongly dependent on the realization of the energetic disorder. Supposing a mixed scheme of primary charge separation with a disorder-controlled competition of the two channels, we can explain the coexistence of fast sub-ps and slow ps components of the Phe-anion formation as revealed by different ultrafast spectroscopic techniques.


Figures

FIGURE 1
FIGURE 1
Simultaneous fit of the low-temperature spectra of isolated PSII-RC. Open circles show the experimental data, solid lines (including thick lines in panels AH and thin lines in EH) represent calculated spectra. (A, C, and D) Modeling of the 6 K OD, CD, and LD spectra (38,39). (B) Modeling of the nonselective FL profile at 5 K (40). (E) Modeling of the 4 K absorption spectra for normal 6-chlorophyll RC (RC6) and for modified RC lacking one of the peripheral Chlzs (RC5). The calculated RC6, RC5, and difference RC6-RC5 spectra are shown together with the measured ones (41). (F and G) Modeling of absorption changes induced by modification of PheD2 (F) or both PheD2 and PheD1 (G) at 5 K (39). Thin solid lines show absorption spectra calculated for normal and modified RCs (the latter have bleachings near 680 nm and absorption peak near 650 nm due to blue-shift of the modified Phes). (H) Modeling of the triplet minus singlet (T-S) spectra measured at 10 K (39). The calculated T-S spectrum (thick line) is obtained as a difference between the ground-state absorption (thin line) and absorption without contribution of the ChlD1 (thin line), implying localization of the triplet state at ChlD1 at 10 K.
FIGURE 2
FIGURE 2
Simultaneous fit of the 77 K spectra of isolated PSII-RC. Points show the experimental data, including OD, FL, and LD spectra (45) and Stark spectrum (26). Solid lines are calculated spectra, where the linear spectra, i.e., OD, FL, and LD are shown together with contributions from the individual exciton states (thin lines). The calculated spectra correspond to a primary charge separation within the special pair, i.e., CT = formula image
FIGURE 3
FIGURE 3
The 77 K FL and Stark spectra calculated with a shift of the CT state by 100 cm−1 to higher (green line) or lower (blue line) energies from its optimal position shown in Fig. 2. Points show the experimental data.
FIGURE 4
FIGURE 4
(Left column) Wavelengths corresponding to the unperturbed site energies (without including a reorganization shift) of eight pigments and the first charge-transfer intermediate formula image (Middle column) Wavelengths of the zero-phonon lines of the exciton eigenstates (averaged over disorder). Lines between left and middle columns indicate participation of the pigments in the exciton states. Numbers (from 4.9 to 28.7 Debye2) near the wavelengths correspond to the dipole strength of the exciton states (averaged over disorder). (Right column) Absorption spectrum (the same as shown in Fig. 2) with the individual exciton components.
FIGURE 5
FIGURE 5
Density matrix for the exciton states from k = 1 to k = 9 averaged over disorder. Bars show the density matrix elements ρ(n,m) in the site representation, where n and m number the eight pigments and CT state in the following order: 1-PD1; 2-PD2; 3-ChlD1; 4-ChlD2; 5-PheD1; 6-PheD2; 7-ChlzD1; 8-ChlzD2; and 9-formula image
FIGURE 6
FIGURE 6
Participation ratio (PR) and dipole strength of the exciton states as a function of the ZPL position calculated for 2500 realizations of the disorder. (Top panel) OD spectrum averaged over disorder (the same as in Fig. 2). The exciton components from k = 1 to k = 9 are labeled by numbers from 1 to 9 and shown by different colors. (Middle panel) PR values for 2500 realizations. PR values for different exciton states are shown by the same colors and have the same labels as exciton components of the OD spectrum. (Bottom panel) The same as in middle panel, but for the dipole strength of the exciton levels.
FIGURE 7
FIGURE 7
The structure of the lowest exciton state that initiates charge separation, and possible configurations of the first CT state. (A) Circles show the pigments that are coherently mixed in a lowest exciton state. The area under the circle is proportional to population of the corresponding site. (BD) Circles show a localization of the electron and hole in the CT states (i.e., formula image and formula image) that can be coupled to the lowest exciton state.
FIGURE 8
FIGURE 8
The best fit of the 77 K FL and Stark spectra obtained with different CT states, i.e., formula image (left), formula image (middle), and formula image (right). Points correspond to experimental data; calculation is shown by solid lines. The Stark signal is calculated with the CT static dipole of 30 D (blue) and 0 (green).
FIGURE 9
FIGURE 9
Comparison of the Stark spectrum and the second derivative of the absorption spectrum (SDS). (A) The Stark spectrum (solid line) and SDS (dotted line) measured at 77 K (26). (B and C) The calculated Stark spectra (solid line) and SDS corresponding to calculated OD (dotted line). The calculated data is obtained with the formula image configuration of the CT state. The Stark signal is calculated with the CT static dipole of 30 D (C) and 0 (B).
FIGURE 10
FIGURE 10
Contributions to the Stark signal due to transitions between the ground state (g), one-exciton (k), and two-exciton states (q) induced by interactions with an optical (open arrows) and static (solid arrows) fields. Diagram 1 corresponds to a pure RWA, diagrams 2–6 and 9–14 correspond to a modified RWA with one off-resonant interaction depending on transition dipoles, and diagrams 7 and 8 contain one off-resonant interaction that depends on permanent dipole.

Similar articles

Cited by

References

    1. Dekker, J. P., and R. van Grondelle. 2000. Primary charge separation in photosystem II. Photosynth. Res. 63:195–208. - PubMed
    1. Diner, B. A., and F. Rappaport. 2002. Structure, dynamics, and energetics of the primary photochemistry of photosystem II of oxygenic photosynthesis. Annu. Rev. Plant Biol. 53:551–580. - PubMed
    1. Yoder, L. M., A. G. Cole, and R. J. Sension. 2002. Structure and function in the isolated reaction center complex of photosystem II: energy and charge transfer dynamics and mechanism. Photosynth. Res. 72:147–158. - PubMed
    1. Barber, J. 2003. Photosystem II: the engine of life. Q. Rev. Biophys. 36:71–89. - PubMed
    1. Zouni, A., H. T. Witt, J. Kern, P. Fromme, N. Krauss, W. Saenger, and P. Orth. 2001. Crystal structure of photosystem II from Synechococcus elongatus at 3.8 Å resolution. Nature. 409:739–743. - PubMed

Publication types

LinkOut - more resources