. 2007 Aug 15;93(4):1347-53.
doi: 10.1529/biophysj.106.091298. Epub 2007 May 25.

Depth-resolved measurement of transient structural changes during action potential propagation

Affiliations

Depth-resolved measurement of transient structural changes during action potential propagation

Taner Akkin et al. Biophys J. .

Abstract

We report noncontact optical measurement of fast transient structural changes in the crustacean nerve during action potential propagation without the need for exogenous chemicals or reflection coatings. The technique, spectral domain optical coherence tomography, provides real-time cross-sectional images of the nerve with micron-scale resolution to select a specific region for functional assessment and interferometric phase sensitivity for subnanometer-scale motion detection. Noncontact optical measurements demonstrate nanometer-scale transient movement on a 1-ms timescale associated with action potential propagation in crayfish and lobster nerves.


Figures

FIGURE 1
FIGURE 1
Schematic of a fiber-based SD-OCT setup and a nerve chamber in its sample arm. The optical setup measures nerve movement relative to a stationary glass-saline interface. Nerve is positioned in a 20-mm-long and 1-mm-wide groove. Electrical stimulation and recording electrodes are made of platinum. Cross-sectional images can be acquired by scanning the beam over the sample laterally; however, the beam is stationary during the actual measurement. ASL, three element air-spaced lens; C, light collimator; G, transmission grating; LSC, line scan camera; SLD, superluminescent diode; Ti:Sapph, mode-locked titanium sapphire laser. Inset shows the optical read out.
FIGURE 2
FIGURE 2
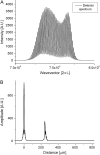
Description of SD-OCT measurement to locate depth-resolved structures. (A) Optical spectrum at the detection arm of the interferometer, showing a strong modulation on the spectrum due to a single reflective surface in the sample arm. (B) Fourier transform of the optical spectrum, giving the spatial information in the sample arm. The peak at zero is a Fourier transform of the source spectrum; the peak at 240 μm is the reflective object causing modulations on the spectrum. The width of the peaks corresponds to axial resolution, which is inversely proportional to the bandwidth of the light source spectrum.
FIGURE 3
FIGURE 3
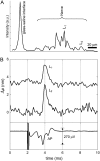
Optical detection of AP propagation in a crayfish leg nerve. (A) Depth profile showing the glass-saline interface and multiple surfaces within the nerve. Labels L1 and L2 indicate two locations inside the crayfish nerve. (B) Optical path length changes due to transient displacement during AP propagation at locations L1 and L2 and corresponding compound AP recorded differentially with respect to ground by a pair of platinum electrodes that are placed before and after the optical read-out area. Transient increase in optical signal represents a displacement toward the reference glass surface. Stimulus (1 mA, 50 μs) is presented at 2 ms and caused a localized artifact in the electrical measurement. Fifty responses are averaged in each trace.
FIGURE 4
FIGURE 4
Optical detection of AP propagation in a lobster leg nerve. (A) Cross-sectional SD-OCT image shows several nerve fibers. Horizontal line corresponds to the glass-saline interface. (B) Optical path length change due to transient displacement of the location indicated by the upper arrow during AP and corresponding compound AP recorded differentially with respect to ground by a pair of platinum electrodes that are placed before and after the optical read-out area. Optical signal represents a transient displacement toward the reference glass surface and suggests movement of the top surface of nerve fiber in swelling direction. Stimulus (300 μA, 50 μs) is presented at 2 ms and caused a localized artifact in the electrical measurement. (C) Optical path length change of a depth location indicated by the lower arrow represents a displacement during AP propagation that is away from the reference glass. (D) Optical path length increase measured between the two points indicated by the arrows shows that a reference glass may not be necessary for the measurement. One hundred responses are averaged in each trace.

Similar articles

Cited by

References

    1. Cohen, L. B. 1973. Changes in neuron structure during action potential propagation and synaptic transmission. Physiol. Rev. 53:373–418. - PubMed
    1. Cohen, L. B., R. D. Keynes, and B. Hille. 1968. Light scattering and birefringence changes during nerve activity. Nature. 218:438–441. - PubMed
    1. Tasaki, I., A. Watanabe, R. Sandlin, and L. Carnay. 1968. Changes in fluorescence, turbidity, and birefringence associated with nerve excitation. Proc. Natl. Acad. Sci. USA. 61:883–888. - PMC - PubMed
    1. Cohen, L. B., B. Hille, and R. D. Keynes. 1969. Light scattering and birefringence changes during activity in the electric organ of electrophorus. J. Physiol. (Lond.). 203:489–509. - PMC - PubMed
    1. von Muralt, A. 1975. The optical spike. Philos. Trans. R. Soc. Lond. B Biol. Sci. B270:411–423. - PubMed

Publication types

LinkOut - more resources