. 2007 Aug;189(15):5472-81.
doi: 10.1128/JB.00529-07. Epub 2007 May 25.

CsrA inhibits translation initiation of Escherichia coli hfq by binding to a single site overlapping the Shine-Dalgarno sequence

Affiliations

CsrA inhibits translation initiation of Escherichia coli hfq by binding to a single site overlapping the Shine-Dalgarno sequence

Carol S Baker et al. J Bacteriol. 2007 Aug.

Abstract

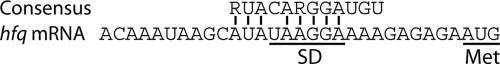
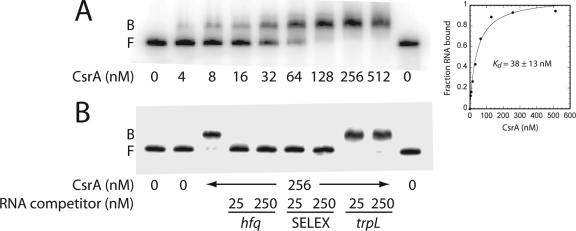
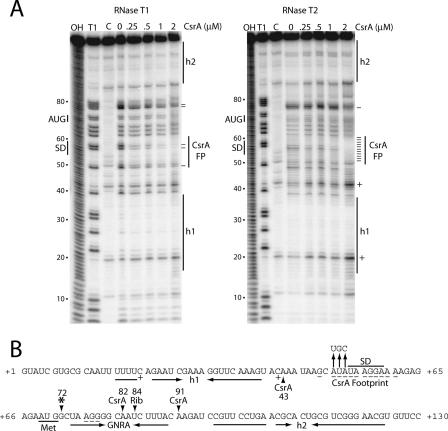
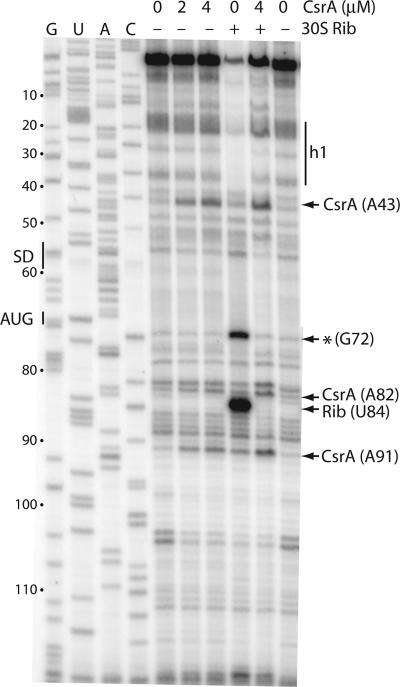
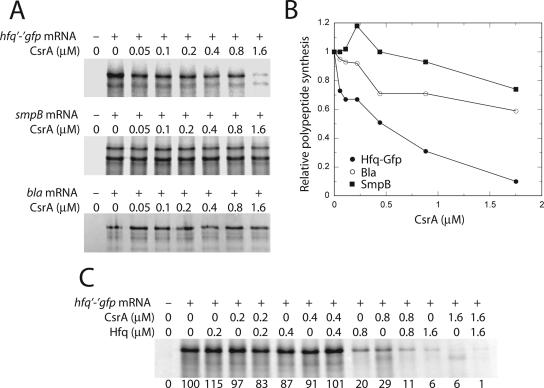
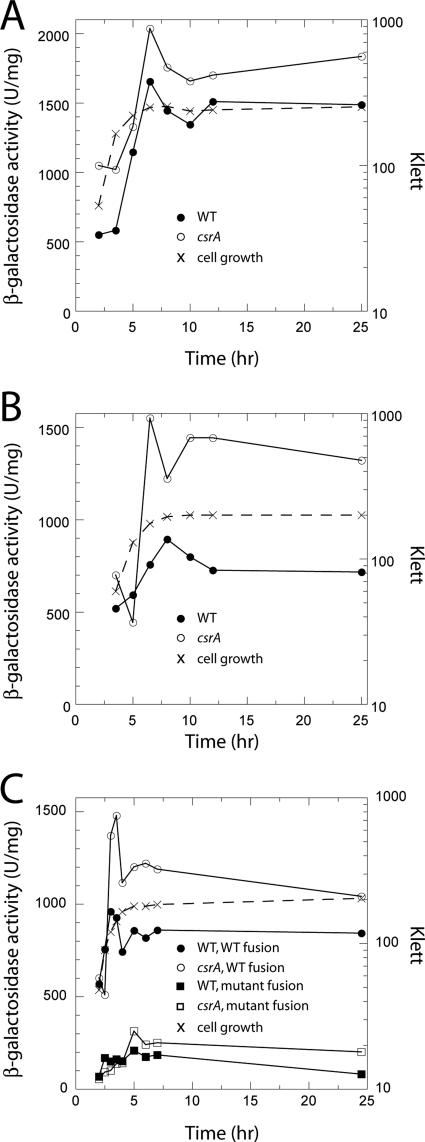
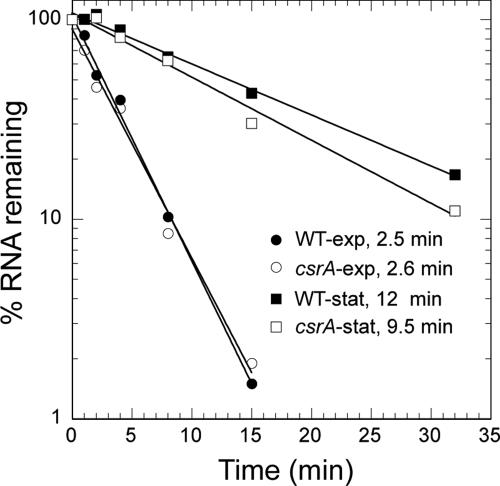
Csr (carbon storage regulation) of Escherichia coli is a global regulatory system that consists of CsrA, a homodimeric RNA binding protein, two noncoding small RNAs (sRNAs; CsrB and CsrC) that function as CsrA antagonists by sequestering this protein, and CsrD, a specificity factor that targets CsrB and CsrC for degradation by RNase E. CsrA inhibits translation initiation of glgC, cstA, and pgaA by binding to their leader transcripts and preventing ribosome binding. Translation inhibition is thought to contribute to the observed mRNA destabilization. Each of the previously known target transcripts contains multiple CsrA binding sites. A position-specific weight matrix search program was developed using known CsrA binding sites in mRNA. This search tool identified a potential CsrA binding site that overlaps the Shine-Dalgarno sequence of hfq, a gene that encodes an RNA chaperone that mediates sRNA-mRNA interactions. This putative CsrA binding site matched the SELEX-derived binding site consensus sequence in 8 out of 12 positions. Results from gel mobility shift and footprint assays demonstrated that CsrA binds specifically to this site in the hfq leader transcript. Toeprint and cell-free translation results indicated that bound CsrA inhibits Hfq synthesis by competitively blocking ribosome binding. Disruption of csrA caused elevated expression of an hfq'-'lacZ translational fusion, while overexpression of csrA inhibited expression of this fusion. We also found that hfq mRNA is stabilized upon entry into stationary-phase growth by a CsrA-independent mechanism. The interaction of CsrA with hfq mRNA is the first example of a CsrA-regulated gene that contains only one CsrA binding site.


Figures

FIG. 1.
FIG. 1.
Predicted CsrA binding site overlapping the hfq SD sequence. The SELEX-derived CsrA binding site consensus sequence is shown above the predicted CsrA binding site in hfq mRNA. Vertical lines mark the residues in the predicted site that match those in the consensus. Positions of the hfq SD sequence and translation initiation codon (Met) are shown.
FIG. 2.
FIG. 2.
Gel mobility shift analysis of the CsrA-hfq RNA interaction. 5′-end-labeled hfq RNA was incubated with the concentration of CsrA shown at the bottom of each lane. Gel shift assays were performed in the absence (A) or presence (B) of various unlabeled competitor RNAs. The concentration of each competitor RNA is shown at the bottom of each lane in panel B. The positions of bound (B) and free (F) hfq RNA are shown at the left of each gel. (A) Determination of the equilibrium binding constant of the CsrA-hfq RNA interaction. The simple binding curve for these data is shown at the right. (B) Competition assay for the CsrA-hfq RNA interaction to establish binding specificity. Lanes corresponding to competition with specific (hfq and SELEX) and nonspecific (trpL) RNAs are indicated.
FIG. 3.
FIG. 3.
CsrA-hfq RNA footprint analysis. (A) hfq RNA was treated with RNase T1 or RNase T2 in the absence or presence of CsrA. The concentration of CsrA used is indicated at the top of each lane. Partial alkaline hydrolysis (OH) and RNase T1 digestion (T1) ladders, as well as control (C) lanes in the absence of RNase treatment, are shown. The RNase T1 ladder was generated under denaturing conditions so that every G residue in the transcript could be visualized. Residues in which RNase cleavage was reduced (−) or enhanced (+) in the presence of CsrA are marked. The positions of the CsrA footprint (FP), the hfq SD sequence, and the translation initiation codon (AUG) are shown. Two RNA segments corresponding to RNA secondary structures (h1 and h2) that were previously identified are shown (41). Numbering at the left of each gel is from the start of hfq transcription. (B) Summary of the hfq footprint results (from panel A) and toeprint results (from Fig. 4, below). The composite CsrA footprint shows the residues in which cleavage was reduced (−) or enhanced (+) by the presence of bound CsrA. Residues corresponding to the CsrA-dependent and 30S ribosomal subunit (Rib) toeprints are marked with arrowheads. An additional 30S ribosomal subunit-dependent toeprint is marked (*). The positions of the hfq SD sequence and translation initiation codon (Met) are indicated. Inverted horizontal arrows identify the residues corresponding to h1, h2, and a short RNA hairpin containing a GNRA tetraloop. Vertical arrows identify a triple nucleotide substitution introduced into the CsrA binding site. Numbering is from the start of hfq transcription.
FIG. 4.
FIG. 4.
CsrA and 30S ribosomal subunit toeprint analysis of hfq RNA. The concentration of CsrA used in each reaction mixture, as well as the absence (−) or presence (+) of tRNAfMet and 30S ribosomal subunits (30S Rib), is shown at the top of each lane. CsrA was added prior to 30S ribosomal subunits when both were present in the same reaction mixture. Arrows identify CsrA-dependent and 30S ribosomal subunit (Rib) toeprint bands. An additional 30S ribosomal subunit-dependent toeprint is marked (*). Positions of the hfq SD sequence and the translation initiation codon (AUG) are shown. The RNA segment corresponding to h1 is also shown. Sequencing lanes to reveal G, U, A, or C residues are marked. Numbering is from the start of hfq transcription.
FIG. 5.
FIG. 5.
Effect of CsrA and Hfq on in vitro translation of hfq′-′gfp mRNA. The E. coli S-30 extract was prepared from a CsrA-deficient strain. (A) Reactions were carried out with the concentration of CsrA indicated at the top of each lane in the absence (−) or presence (+) of hfq′-′gfp or control (smpB or bla) transcripts. Hfq-GFP, SmpB, and Bla translation products were analyzed by SDS-PAGE. (B) Relative levels of Hfq-GFP, SmpB, and Bla polypeptide synthesis as a function of CsrA concentration. All of the bands shown in panel A were used for quantifying the effect of CsrA on protein synthesis. The level of polypeptide synthesis in the absence of CsrA was set to 1.0 for each transcript. (C) Reactions were carried out with the concentration of CsrA and/or Hfq indicated at the top of each lane in the absence (−) or presence (+) of hfq′-′gfp transcripts. Hfq-GFP products were analyzed by SDS-PAGE. The relative level of polypeptide synthesis is shown at the bottom of each lane. The level of polypeptide synthesis in the absence of CsrA and Hfq was set to 100.
FIG. 6.
FIG. 6.
CsrA-dependent regulation of an hfq′-′lacZ translational fusion. Cells were harvested at various times throughout growth and assayed for β-galactosidase activity. Growth medium was LB (A and B) or LB supplemented with 1% glucose (C). Growth curves for each strain in panels A, B, and C were essentially identical. The time shown is hours of cell growth. These experiments were conducted at least three times with similar results. Results from representative experiments are shown. (A) β-Galactosidase activity was determined for PLB785 (wild type [WT]) and PLB786 (csrA::kan). Cell growth was measured in strain PLB785. (B) β-Galactosidase activity was determined for PLB793 (csrA::kan/pCRA16 [WT]) and PLB789 (csrA::kan/pBR322 [csrA]). Cell growth was measured in strain PLB789. (C) β-Galactosidase activity was determined for PLB785 (WT, WT fusion), PLB786 (csrA::kan [csrA, WT fusion]), PLB923 (WT with mutant hfq′-′lacZ fusion), and PLB924 (csrA::kan [csrA] with mutant hfq′-′lacZ fusion). Cell growth was measured in strain PLB785.
FIG. 7.
FIG. 7.
Effects of growth phase and CsrA on hfq mRNA stability. hfq mRNA half-lives were determined in wild-type (WT) and csrA mutant strains during the exponential and early stationary phases of growth. The relative levels of mRNA remaining at 0, 1, 2, 4, 8, 15, and 32 min after the addition of rifampin were determined by RT-qRT-PCR. The mRNA level corresponding to each 0-min time point was set to 100. The mRNA half-life for each strain and growth phase is shown next to the corresponding symbol. Strains used were MG1655 (wild type) in exponential phase (WT-exp), TR1-MG1655 (csrA::kan) in exponential phase (csrA-exp), MG1655 in early stationary phase (WT-stat), and TR1-MG1655 in early stationary phase (csrA-stat).

References

    1. Babitzke, P., and T. Romeo. 2007. CsrB sRNA family: sequestration of RNA-binding regulatory proteins. Curr. Opin. Microbiol. 10:156-163. - PubMed
    1. Baker, C. S., I. Morozov, K. Suzuki, T. Romeo, and P. Babitzke. 2002. CsrA regulates glycogen biosynthesis by preventing translation of glgC in Escherichia coli. Mol. Microbiol. 44:1599-1610. - PubMed
    1. Bevilacqua, J. M., and P. C. Bevilacqua. 1998. Thermodynamic analysis of an RNA combinatorial library contained in a short hairpin. Biochemistry 37:15877-15884. - PubMed
    1. Bolivar, F., R. L. Rodriguez, P. J. Greene, M. C. Betlach, H. L. Heyneker, and H. W. Boyer. 1977. Construction and characterization of new cloning vehicles. II. A multipurpose cloning system. Gene 2:95-113. - PubMed
    1. Boyd, D., D. S. Weiss, J. C. Chen, and J. Beckwith. 2000. Towards single-copy gene expression systems making gene cloning physiologically relevant: lambda InCh, a simple Escherichia coli plasmid-chromosome shuttle system. J. Bacteriol. 182:842-847. - PMC - PubMed

Publication types

MeSH terms

LinkOut - more resources