. 2007 Aug;27(15):5544-53.
doi: 10.1128/MCB.02070-06. Epub 2007 May 25.

Specificity and complexity of the Caenorhabditis elegans innate immune response

Affiliations

Specificity and complexity of the Caenorhabditis elegans innate immune response

Scott Alper et al. Mol Cell Biol. 2007 Aug.

Abstract

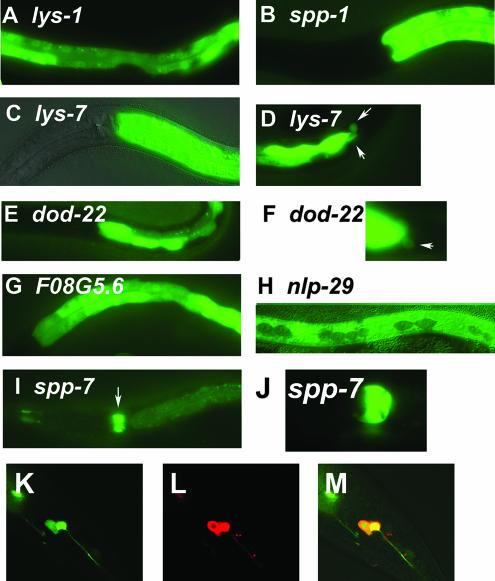
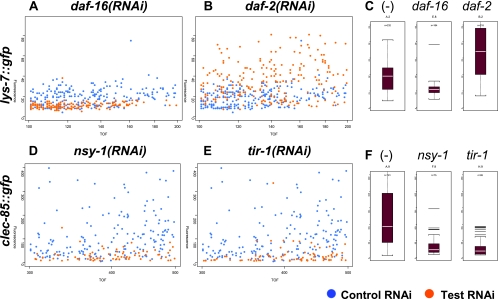
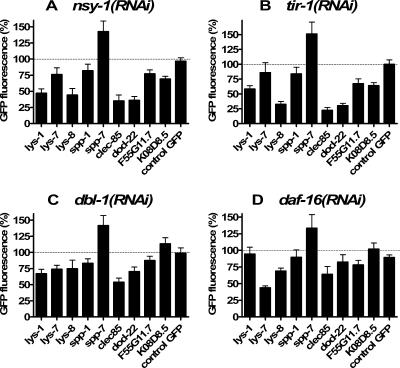
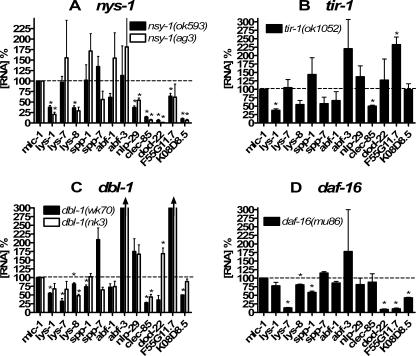
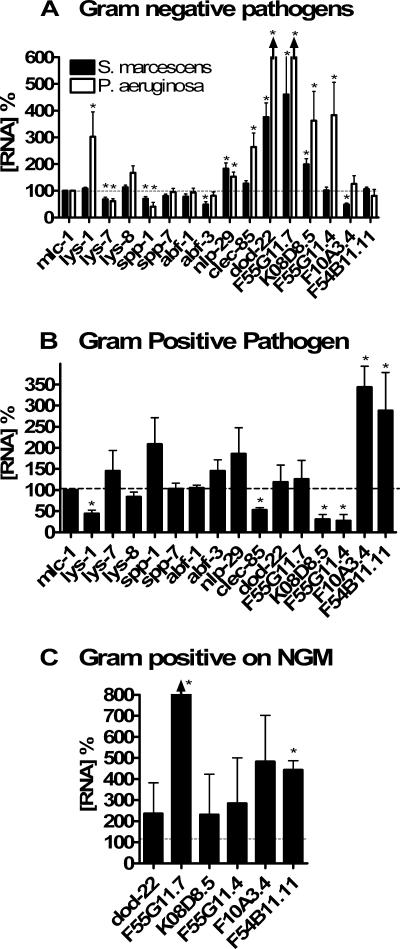
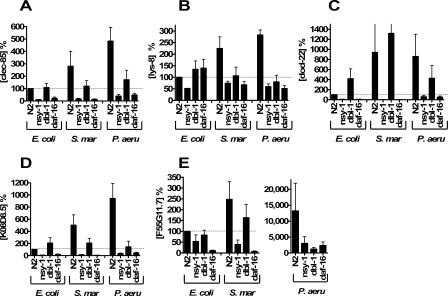
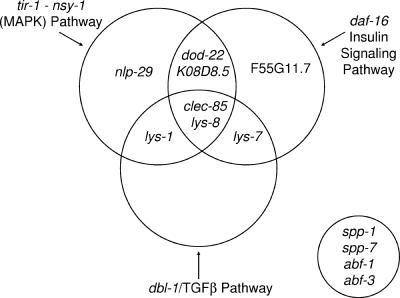
In response to infection, Caenorhabditis elegans produces an array of antimicrobial proteins. To understand the C. elegans immune response, we have investigated the regulation of a large, representative sample of candidate antimicrobial genes. We found that all these putative antimicrobial genes are expressed in tissues exposed to the environment, a position from which they can ward off infection. Using RNA interference to inhibit the function of immune signaling pathways in C. elegans, we found that different immune response pathways regulate expression of distinct but overlapping sets of antimicrobial genes. We also show that different bacterial pathogens regulate distinct but overlapping sets of antimicrobial genes. The patterns of genes induced by pathogens do not coincide with any single immune signaling pathway. Thus, even in this simple model system for innate immunity, striking specificity and complexity exist in the immune response. The unique patterns of antimicrobial gene expression observed when C. elegans is exposed to different pathogens or when different immune signaling pathways are perturbed suggest that a large set of yet to be identified pathogen recognition receptors (PRRs) exist in the nematode. These PRRs must interact in a complicated fashion to induce a unique set of antimicrobial genes. We also propose the existence of an "antimicrobial fingerprint," which will aid in assigning newly identified C. elegans innate immunity genes to known immune signaling pathways.


Figures

FIG. 1.
FIG. 1.
C. elegans candidate antimicrobial genes are expressed in tissues exposed to the environment. Panels A to J depict representative fluorescence micrographs of the indicated GFP fusion-bearing strains (panels C and H are overlays of fluorescence and Nomarski micrographs). Strong intestinal gfp expression is observed in panels A (mid-body view), B, C, E, and G (anterior to mid-body view), and D and F (posterior view). Weak intestinal gfp expression and strong pharyngeal gfp expression are observed in panel I. Panel J is a close-up view of the pharyngeal expression in panel I. White arrows point to rectal gland gfp expression in panels D and F or to pharyngeal expression in panel I. Panels K, L, and M are confocal microscopy images of the posterior part of the same nematode expressing lys-1::gfp. Panel K depicts gfp expression (green), panel L depicts animals filled with the dye DiI, which labels some chemosensory neurons (red), and panel M depicts the overlap (yellow), demonstrating that this gfp fusion is expressed in two chemosensory phasmid neurons. Anterior is to the left and ventral is down in all images. A complete summary of the gfp expression data for all 14 antimicrobial::gfp fusions is presented in Table 1.
FIG. 2.
FIG. 2.
Use of the COPAS Biosort to assay changes in antimicrobial::gfp expression. Nematodes harboring either the lys-7::gfp fusion (panels A to C) or the clec-85::gfp fusion (panels D to F) were treated with the indicated dsRNA as described in Materials and Methods. Panels A, B, D, and E are overlay graphs comparing the indicated RNAi test treatment (orange dots) to control-treated animals (blue dots). Each dot represents a single animal. The x axis represents the time of flight (TOF), or length of each animal in arbitrary units, and the y axis represents total fluorescence in arbitrary units. Panels C and F are boxplots, displaying the median fluorescence (white horizontal bar) and the 25th and 75th percentiles of fluorescence (lower and upper limits of each boxplot, respectively). (-) indicates a control RNAi treatment.
FIG. 3.
FIG. 3.
Use of RNAi to investigate the role of known immune signaling pathways in the regulation of antimicrobial gene expression. Nine different antimicrobial::gfp strains and one control::gfp strain were treated with one of the four indicated RNAi bacteria, and fluorescence was measured using the COPAS Biosort. In parallel, these gfp strains were treated with a control bacterial strain that was expected to have no effect on gfp expression. Mean fluorescence for each strain and each treatment was then calculated and normalized relative to the control RNAi bacteria treatment. GFP fluorescence is plotted as the percentage of this control treatment. Each assay was performed a minimum of four times.
FIG. 4.
FIG. 4.
Use of real-time RT-PCR to measure antimicrobial RNA in immune pathway mutant nematodes. The indicated nematode strains were prepared and collected. RNA was purified from each strain, and antimicrobial gene expression was assayed by real-time RT-PCR using mlc-1 to normalize RNA concentration. Expression was measured relative to the wild-type strain N2, which was grown in parallel. Depicted on the graph are the means of three independent experiments. Panel A depicts two different mutant variants of nsy-1 animals compared to the wild type. Panel B depicts tir-1, panel C dbl-1, and panel D daf-16. Expression levels that were significantly different from the wild type (P < 0.05) are indicated with an asterisk (P values were calculated using one-sample t tests). As indicated by the arrowheads in panel C, expression of abf-3 (432% and 329% in wk70 and nk3 alleles, respectively) and F55G11.7 (311% and 565% in wk70 and nk3 alleles, respectively) was off scale in this figure.
FIG. 5.
FIG. 5.
Different pathogens induce the expression of different antimicrobial genes in C. elegans. Nematodes were incubated in the presence of different bacteria as described in Materials and Methods. RNA was prepared, and antimicrobial gene expression was assayed by real-time RT-PCR using mlc-1 to normalize RNA concentration. Expression of the antimicrobial genes on gram-negative pathogens was normalized relative to E. coli. Expression of antimicrobials on the gram-positive pathogen was normalized relative to B. subtilis (B) or E. coli (C). Expression levels that were significantly different from control (P < 0.05) are indicated with an asterisk (P values were calculated using one-sample t tests). lys-1, clec-85, and F55G11.7 were the only genes whose expression was significantly different between the two gram-negative treatments (P < 0.05; t test). As indicated by the arrowheads in panel A, expression of dod-22 (775%) and F55G11.7 (>10,000%) in the presence of P. aeruginosa was off scale in this figure.
FIG. 6.
FIG. 6.
Role of immune pathways in regulation of pathogen-induced antimicrobial gene expression. The four indicated nematode strains [N2 (the wild type), nsy-1(ok593), dbl-1(nk3), daf-16(mu86)] were exposed to either E. coli, S. marcescens, or P. aeruginosa, RNA was isolated, and antimicrobial gene expression was monitored using mlc-1 to normalize for RNA concentration. Expression was measured relative to the wild-type N2 strain grown on E. coli. Note the change of scale for P. aeruginosa in panel E. Depicted are the results of three independent experiments.
FIG. 7.
FIG. 7.
A model for the regulation of antimicrobial gene expression in C. elegans. Depicted in the Venn diagram are the genes regulated by each of the three immune signaling pathways in C. elegans. The data are a summary of the RNAi and real-time RT-PCR data. Genes that lie within two or three circles are regulated by multiple pathways. The four genes in the circle at the lower right were constitutively expressed and were not strongly regulated by any of the immune signaling pathways tested.

References

    1. Aballay, A., E. Drenkard, L. R. Hilbun, and F. M. Ausubel. 2003. Caenorhabditis elegans innate immune response triggered by Salmonella enterica requires intact LPS and is mediated by a MAPK signaling pathway. Curr. Biol. 13:47-52. - PubMed
    1. Ahringer, J. (ed.). 6 April 2006, posting date. Reverse genetics. In The C. elegans Research Community (ed.), WormBook. http://www.wormbook.org.
    1. Alegado, R. A., M. C. Campbell, W. C. Chen, S. S. Slutz, and M. W. Tan. 2003. Characterization of mediators of microbial virulence and innate immunity using the Caenorhabditis elegans host-pathogen model. Cell. Microbiol. 5:435-444. - PubMed
    1. Banyai, L., and L. Patthy. 1998. Amoebapore homologs of Caenorhabditis elegans. Biochim. Biophys. Acta 1429:259-264. - PubMed
    1. Chuang, C. F., and C. I. Bargmann. 2005. A Toll-interleukin 1 repeat protein at the synapse specifies asymmetric odorant receptor expression via ASK1 MAPKKK signaling. Genes Dev. 19:270-281. - PMC - PubMed

Publication types

MeSH terms

Substances

LinkOut - more resources