. 2007 Aug;27(15):5381-92.
doi: 10.1128/MCB.00282-07. Epub 2007 May 25.

Hypoxia-inducible factor linked to differential kidney cancer risk seen with type 2A and type 2B VHL mutations

Affiliations

Hypoxia-inducible factor linked to differential kidney cancer risk seen with type 2A and type 2B VHL mutations

Lianjie Li et al. Mol Cell Biol. 2007 Aug.

Abstract

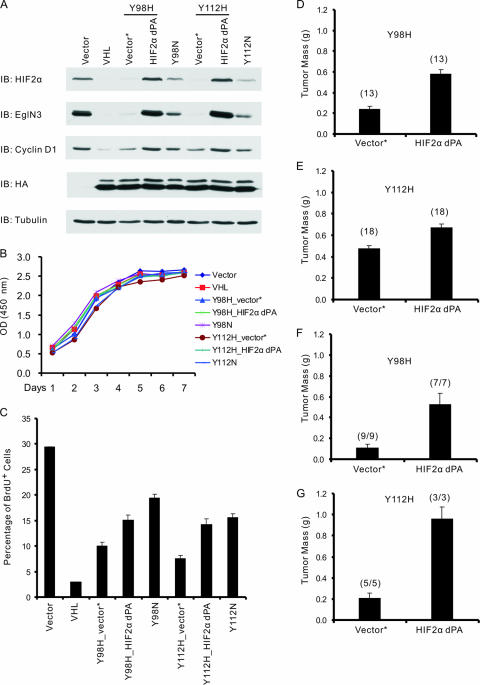
Clear cell carcinoma of the kidney is a major cause of mortality in patients with von Hippel-Lindau (VHL) disease, which is caused by germ line mutations that inactivate the VHL tumor suppressor gene. Biallelic VHL inactivation, due to mutations or hypermethylation, is also common in sporadic clear cell renal carcinomas. The VHL gene product, pVHL, is part of a ubiquitin ligase complex that targets the alpha subunits of the heterodimeric transcription factor hypoxia-inducible factor (HIF) for destruction under well-oxygenated conditions. All VHL mutations linked to classical VHL disease compromise this pVHL function although some missense mutations result in a low risk of kidney cancer (type 2A VHL disease) while others result in a high risk (type 2B VHL disease). We found that type 2A mutants were less defective than type 2B mutants when reintroduced into VHL-/- renal carcinoma cells with respect to HIF regulation. A stabilized version of HIF2alpha promoted tumor growth by VHL-/- cells engineered to produce type 2A mutants, while knock-down of HIF2alpha in cells producing type 2B mutants had the opposite effect. Therefore, quantitative differences with respect to HIF deregulation are sufficient to account for the differential risks of kidney cancer linked to VHL mutations.


Figures

FIG. 1.
FIG. 1.
Differential regulation of HIFα and HIF target genes by type 2A and type 2B pVHL mutants. (A to C) Immunoblot analysis of 786-O (A and C) and RCC4 (B) renal carcinoma cells infected with retroviruses encoding the indicated HA-tagged pVHL variants or with the empty vector. For panel C cells were grown under hypoxic (H; 1% oxygen) or normoxic (N; 21% oxygen) conditions. (D) Firefly luciferase values, normalized to Renilla luciferase values, for 786-O cells infected with retroviruses encoding the indicated VHL proteins or with empty vector. Cells were transiently transfected with an HIF-responsive firefly luciferase reporter plasmid and a Renilla luciferase control plasmid and grown in the presence of 21% or 1% O2 for 24 h prior to analysis. RLU, relative light units; IB, immunoblot.
FIG. 2.
FIG. 2.
Proliferation of 786-O cells expressing type 2A or type 2B pVHL mutants in vitro. (A) Optical density (OD) at 450 nm, which reflects viable cell number, of 786-O cells stably infected with retroviruses encoding the indicated pVHL variants and maintained in 10% fetal bovine serum. Standard deviation is <0.2 for all data points. (B and C) BrdU incorporation and immunoblot (IB) analysis of 786-O cells stably infected with retroviruses encoding the indicated pVHL variants and maintained in DMEM containing 10% fetal bovine serum (10% FBS) or in DMEM supplemented with 1% insulin-transferrin-selenium (1% ITS) for 72 h prior to BrdU pulse for 2 h. Error bars in panel B indicate the standard deviations. (D) Multicellular spheroids formed by 786-O cells stably infected with retroviruses encoding the indicated pVHL variants. Spheroids were photographed (magnification, ×100) after 7 days of growth. Note that cells producing type 2B mutants form dense cell spheroids similar to those formed by the vector control cells or the cells expressing pVHL(1-115), a type I mutant. Cells producing wild-type pVHL or type 2A mutants form loose spheroids.
FIG. 3.
FIG. 3.
Type 2B mutants have decreased ability to regulate VHL-regulated genes relative to type 2A mutants. (A and B) Comparison of genes regulated by Y98N versus empty vector (y axis) to genes regulated by Y98H versus empty vector (x axis) in 786-O cells (A). Y98N and Y98H have similar effects (hence, most genes lie along diagonal). However, some genes (examples in red font) are repressed more effectively by Y98H than Y98N (therefore, above the diagonal in the lower-left quadrant). This is easier to see in panel B, where Y98H and Y98N are compared to wild-type pVHL to accentuate differences between these two mutants. Genes represented by green plus signs are deregulated in Y98N much more than in Y98H cells. Data shown are representative of two independent experiments. (C and D) Analysis of genes regulated by pVHL(Y112H) or pVHL(Y112N) as in panels A and B. (E) One-dimensional clustering of 786-O cells expressing wild-type pVHL compared to 786-O empty vector cells (top row) or compared to cells producing VHL2A (Y98H and Y112H) or VHL2B (Y98N and Y112N) mutants (bottom four rows) using Rosetta Resolver software. A gene set of consensus pVHL-regulated genes (approximately 270 genes) was used to perform the analysis. The gene set was compiled by requiring a gene to be significantly regulated (P value of <0.01) in two of three experiments comparing 786-O cells expressing wild-type pVHL to empty vector cells. In the upper rows of both panels, genes repressed by pVHL are in blue. These genes are more upregulated (yellow) in cells producing 2B mutants than in cells producing 2A mutants when 2A and 2B mutants are compared to wild-type pVHL.
FIG. 4.
FIG. 4.
Type 2B pVHL mutants display higher tumorigenic potential in nude mice than type 2A mutants. (A and B) Masses of tumors formed by 786-O cells stably infected with retroviruses encoding the indicated pVHL variants 8 weeks after subcutaneous injection in nude mice. Each mouse was injected with cells producing a type 2A mutant or the corresponding type 2B mutant on opposite flanks. The number of tumors analyzed is indicated in parentheses. Error bars are 1 standard error of the mean (P < 0.05). (C) Calculated masses of tumors formed by 786-O cells stably infected with retroviruses encoding the indicated pVHL variants 11 weeks after intraparenchymal renal injection in nude mice. The presence of tumor cells was confirmed by hematoxylin and eosin staining. The tumor mass was calculated by subtracting the mass of the left kidney (normal) from the mass of the right kidney (implanted with tumor). Numbers in parentheses indicate the number of animals with tumors divided by number of animals injected. Error bars are 1 standard error of the mean (P < 0.05). (D) Representative photographs of injected and control kidneys from panel C.
FIG. 5.
FIG. 5.
Stabilizing HIF2α promotes tumor growth by 786-O cells producing type 2A pVHL mutants in vivo. (A) Immunoblot (IB) analysis of 786-O renal carcinoma cells infected with retroviruses encoding the indicated HA-tagged pVHL proteins or with the empty vector (Vector). Where indicated, cells were also infected with a second virus encoding HIF2α dPA (P405A/P531A) or with the corresponding empty virus (Vector*). (B) Optical density (OD) at 450 nm, which reflects viable cell number, of 786-O cells studied in panel A and maintained in 10% fetal bovine serum. The standard deviation is <0.2 for all data points. (C) BrdU incorporation of 786-O cells stably infected with retroviruses as in panel A and maintained in serum-free DMEM supplemented with 1% insulin-transferrin-selenium (1% ITS) for 72 h prior to BrdU pulse for 2 h. Error bars indicate standard deviations. (D and E) Masses of tumors formed by 786-O cells stably infected with retroviruses as in panel A 8 weeks after subcutaneous injection in nude mice. Each mouse was injected with the corresponding empty virus (Vector*) or HIF2α dPA cells on opposite flanks. The number of tumors analyzed is indicated in parentheses. Error bars are 1 standard error of the mean (P < 0.05). (F and G) Calculated masses of tumors formed by 786-O cells stably infected with retroviruses as in panel A 10 weeks (Y98H) or 9 weeks (Y112H) after intraparenchymal renal injection in nude mice. The presence of tumor cells was confirmed by hematoxylin and eosin staining. The tumor mass was calculated by subtracting the mass of the left kidney (normal) from the mass of the right kidney (implanted with tumor). Numbers in parentheses indicate the number of animals with tumors divided by number of animals injected. Error bars are 1 standard error of the mean (P < 0.05).
FIG. 6.
FIG. 6.
HIF2α downregulation in 786-O cells producing type 2B mutants results in decreased tumorigenicity in vivo. (A) Immunoblot (IB) analysis of 786-O cells producing the indicated pVHL variants (or infected with empty vector) and subsequently infected with retroviruses encoding shRNAs targeting HIF2α [shHIF2α(#2) and shHIF2α(#3)] or luciferase (shLuc). (B) Optical density (OD) at 450 nm, which reflects viable cell number, of 786-O cells studied in panel A and maintained in 10% fetal bovine serum. Standard deviation is <0.2 for all data points. (C) BrdU incorporation of 786-O cells stably infected with retroviruses as in panel A and maintained in serum-free DMEM supplemented with 1% insulin-transferrin-selenium (1% ITS) for 72 h prior to BrdU pulse for 2 h. Error bars indicate standard deviations. (D and E) Masses of tumors formed by 786-O cells stably infected with retroviruses as in panel A 8 weeks after subcutaneous injection in nude mice. Each mouse was injected with cells expressing luciferase shRNA or HIF2α shRNA on opposite flanks. The number of tumors analyzed is indicated in parentheses. Error bars indicate 1 standard error of the mean (P < 0.05). (F) Calculated masses of tumors formed by 786-O cells stably infected with a retrovirus encoding pVHL(Y112N) and the indicated shRNA retrovirus 10 weeks after intraparenchymal renal injection in nude mice. The presence of tumor cells was confirmed by hematoxylin and eosin staining. The tumor mass was calculated by subtracting the mass of the left kidney (normal) from the mass of the right kidney (implanted with tumor). Numbers in parentheses indicate the number of animals with tumors divided by the number of animals injected. Error bars indicate 1 standard error of the mean (P < 0.05).

Similar articles

Cited by

References

    1. An, Z., P. Jiang, X. Wang, A. R. Moossa, and R. M. Hoffman. 1999. Development of a high metastatic orthotopic model of human renal cell carcinoma in nude mice: benefits of fragment implantation compared to cell-suspension injection. Clin. Exp. Metastasis 17:265-270. - PubMed
    1. Appelhoff, R. J., Y. M. Tian, R. R. Raval, H. Turley, A. L. Harris, C. W. Pugh, P. J. Ratcliffe, and J. M. Gleadle. 2004. Differential function of the prolyl hydroxylases PHD1, PHD2, and PHD3 in the regulation of hypoxia-inducible factor. J. Biol. Chem. 279:38458-38465. - PubMed
    1. Aprelikova, O., G. V. Chandramouli, M. Wood, J. R. Vasselli, J. Riss, J. K. Maranchie, W. M. Linehan, and J. C. Barrett. 2004. Regulation of HIF prolyl hydroxylases by hypoxia-inducible factors. J. Cell Biochem. 92:491-501. - PubMed
    1. Benjamin, L. E., and E. Keshet. 1997. Conditional switching of vascular endothelial growth factor (VEGF) expression in tumors: induction of endothelial cell shedding and regression of hemangioblastoma-like vessels by VEGF withdrawal. Proc. Natl. Acad. Sci. USA 94:8761-8766. - PMC - PubMed
    1. Bruick, R. K., and S. L. McKnight. 2001. A conserved family of prolyl-4-hydroxylases that modify HIF. Science 294:1337-1340. - PubMed

Publication types

Substances