. 2007 Jul;73(14):4631-8.
doi: 10.1128/AEM.00144-07. Epub 2007 May 25.

A general framework for designing and validating oligomer-based DNA microarrays and its application to Clostridium acetobutylicum

Affiliations

A general framework for designing and validating oligomer-based DNA microarrays and its application to Clostridium acetobutylicum

Carlos J Paredes et al. Appl Environ Microbiol. 2007 Jul.

Abstract

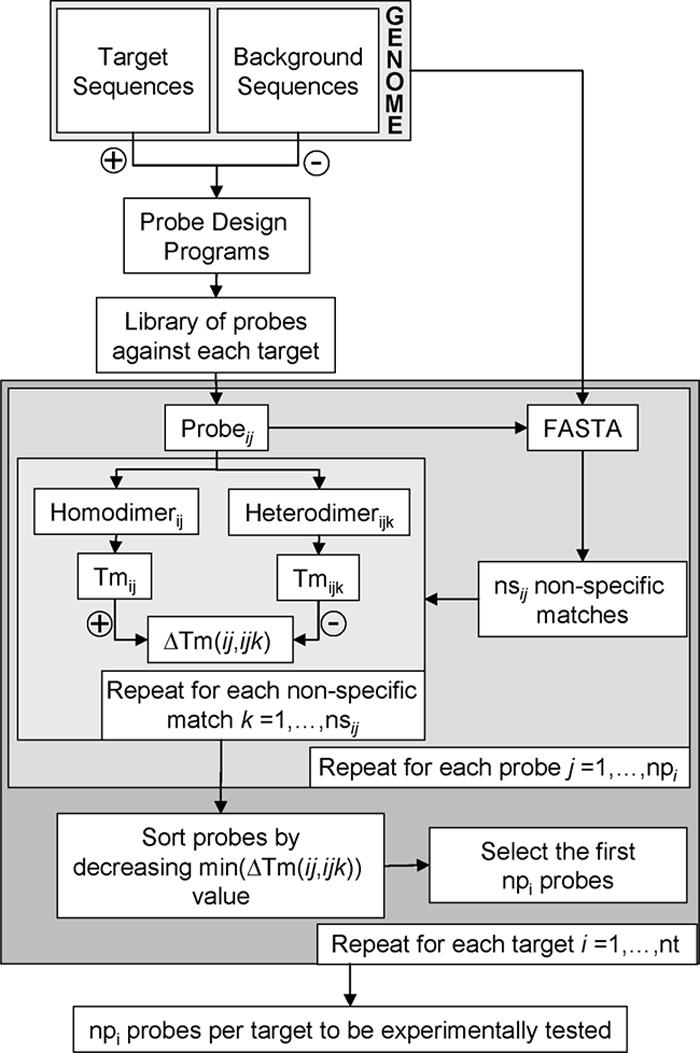
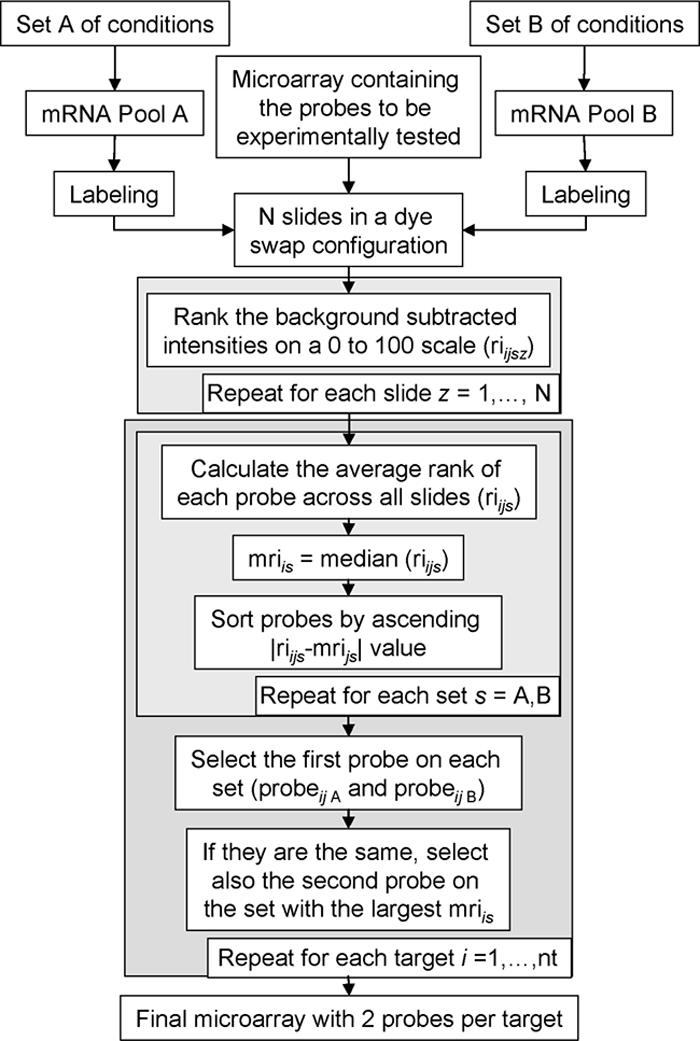
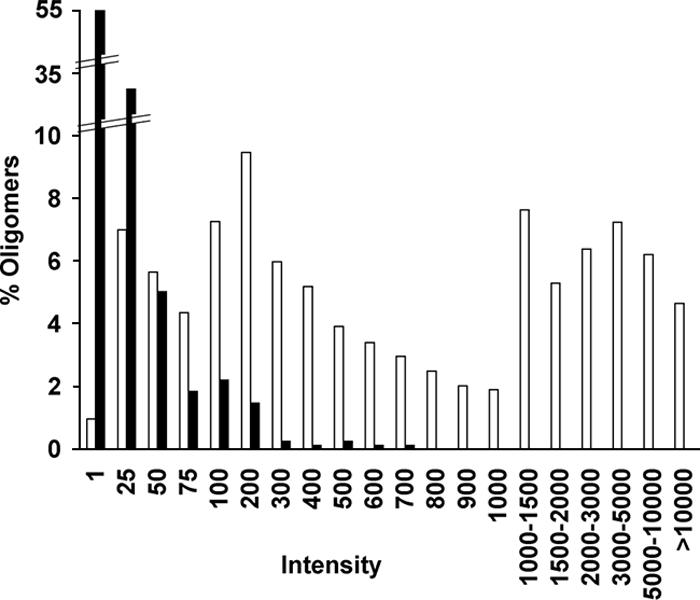
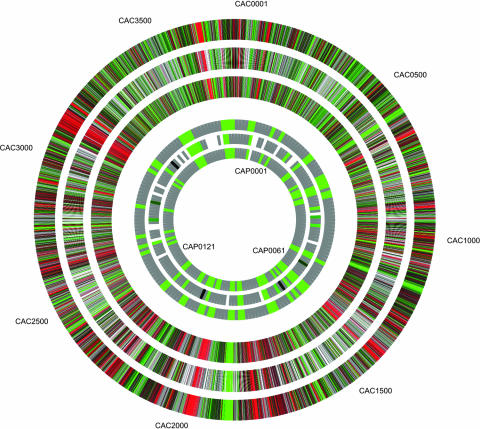
While DNA microarray analysis is widely accepted as an essential tool for modern biology, its use still eludes many researchers for several reasons, especially when microarrays are not commercially available. In that case, the design, construction, and use of microarrays for a sequenced organism constitute substantial, time-consuming, and expensive tasks. Recently, it has become possible to construct custom microarrays using industrial manufacturing processes, which offer several advantages, including speed of manufacturing, quality control, no up-front setup costs, and need-based microarray ordering. Here, we describe a strategy for designing and validating DNA microarrays manufactured using a commercial process. The 22K microarrays for the solvent producer Clostridium acetobutylicum ATCC 824 are based on in situ-synthesized 60-mers employing the Agilent technology. The strategy involves designing a large library of possible oligomer probes for each target (i.e., gene or DNA sequence) and experimentally testing and selecting the best probes for each target. The degenerate C. acetobutylicum strain M5 lacking the pSOL1 megaplasmid (with 178 annotated open reading frames [genes]) was used to estimate the level of probe cross-hybridization in the new microarrays and to establish the minimum intensity for a gene to be considered expressed. Results obtained using this microarray design were consistent with previously reported results from spotted cDNA-based microarrays. The proposed strategy is applicable to any sequenced organism.


Figures

FIG. 1.
FIG. 1.
Flow diagram for designing a library of probes for all the target sequences of the C. acetobutylicum genome and selecting several probes per target to be experimentally tested. A target sequence is any sequence in the genome for which a probe has to be designed. The total number of target sequences is represented by nt. A background sequence is any sequence in the genome for which a probe will not be designed. Subscript i indicates a particular target sequence, and subscript j indicates a particular probe; thus, probeij is the jth probe designed for the ith target sequence, and the total number of probes per target is denoted by npi. The total number of selected nonspecific matches for each probe is denoted by nsij, and subscript k is used to denote a particular nonspecific match for probeij. Homodimerij is the dimer formed by probeij and its complementary sequence (i.e., its target), whereas heterodimerijk is the dimer formed by probeij and the complementary sequence of its kth nonspecific match. The difference in Tm between a homodimer and a heterodimer in a pair is represented by ΔTm. The number of desired probes per target to be tested is represented by npi.
FIG. 2.
FIG. 2.
Flow chart detailing the process of selecting two probes per target by using two-color microarrays. Two different mRNA pools (A and B) representing two different conditions or phenotypes are used to maximize the number of targets expressed. Subscript s is used to refer to an mRNA pool, nt represents the total number of target sequences, subscript i is used to denote one of the nt target sequences, and subscript j indicates a particular probe. To account for target-specific dye bias, a dye swap configuration is needed, and to account for technical replication variability, several slides are required. We represent the total number of arrays hybridized as N, and subscript z is used to refer to a particular array. We use riijsz to indicate the ranked intensity, minus the background, of the jth probe against the ith target as measured on the zth slide on the channel containing the sth mRNA pool. Intensities, minus the background, were sorted in increasing order; a rank of zero was assigned the first member of the sorted list, whereas a rank of 100 was assigned the last member of the list, and the ranks of the remaining members of the list were proportional to their ordinals on the sorted list.
FIG. 3.
FIG. 3.
Most relevant properties of the library of probes generated in the first step of our microarray design. (A) Distribution of the numbers of probes per target. An average of 32 different probes per target was obtained. (B) Tm distribution. As different programs use different methods and/or sets of constants to calculate the Tm of a probe, all of the Tms were recalculated using Hybrid 2.5 (16) as described in reference . (C) G+C content distribution.
FIG. 4.
FIG. 4.
Distribution of intensities, minus the background, of the array probes on the M5 channel for pSOL1 genes (solid bars) and chromosomal genes (open bars) when 1 μg of labeled cDNA was used. Intensities are expressed in units.
FIG. 5.
FIG. 5.
Reproducibility of expression ratios measured by the duplicate probes of the final array (design III). All duplicate probes are shown regardless of their mean intensity values. The regression line between ratios has a slope of 0.9418, an intercept (x = 0) of 0.0022, and an R2 value of 0.8881.
FIG. 6.
FIG. 6.
Consistency between our previous cDNA platform and the probes from our final array (design III). The three outer rings represent the chromosomal genes, whereas the three inner rings represent the pSOL1 genes. For each set of rings, the central ring shows the ratio measured using the cDNA array whereas the other two rings present the ratios obtained using the two different probes in the oligomer array. Gray segments indicate probes (either cDNA or oligomer) with intensities below the mean intensity cutoffs of 300 U for cDNA probes and 50 U for oligomer probes. White segments on the cDNA rings indicate open reading frames not previously covered in our array. For those targets with only one probe on the array, the corresponding segment in either the external or internal ring is white. Ratios were calculated as the M5 value divided by the wild-type value; saturated red indicates a ratio of 3 or greater, black indicates a ratio of 1, and saturated green indicates a ratio of 1/3 or smaller. Quantitative data for this figure can be found in the supplemental material.
FIG. 7.
FIG. 7.
Percentages of similarity between the probes from designs I and II and their four nonspecific matches. The percentage of similarity between each probe and each one of its four highest-scoring nonspecific matches returned by FASTA was calculated by using the rigorous Needleman-Wunsch global alignment algorithm as implemented in EMBOSS (29). Despite allowing the probe generation programs a maximum similarity of up to 80%, the bulk of the probes presented a similarity to their nonspecific matches of 70% or less.

Similar articles

Cited by

References

    1. Alsaker, K. V., C. J. Paredes, and E. T. Papoutsakis. 2005. Design, optimization and validation of genomic DNA microarrays for examining the Clostridium acetobutylicum transcriptome. Biotechnol. Bioprocess Eng. 10:432-443.
    1. Bozdech, Z., J. C. Zhu, M. P. Joachimiak, F. E. Cohen, B. Pulliam, and J. L. DeRisi. 2003. Expression profiling of the schizont and trophozoite stages of Plasmodium falciparum with a long-oligonucleotide microarray. Genome Biol. 4:R9. - PMC - PubMed
    1. Casci, T. 2001. Technology. ChIP on chips. Nat. Rev. Genet. 2:88. - PubMed
    1. Chou, H. H., A. P. Hsia, D. L. Mooney, and P. S. Schnable. 2004. PICKY: oligo microarray design for large genomes. Bioinformatics 20:2893-2902. - PubMed
    1. Churchill, G. A. 2002. Fundamentals of experimental design for cDNA microarrays. Nat. Genet. 32:490-495. - PubMed

Publication types

MeSH terms

Substances