. 2007 Jun 19;46(24):7146-52.
doi: 10.1021/bi700548a. Epub 2007 May 26.

Differential stability of dimeric and monomeric cytochrome c oxidase exposed to elevated hydrostatic pressure

Affiliations

Differential stability of dimeric and monomeric cytochrome c oxidase exposed to elevated hydrostatic pressure

Jana Stanicová et al. Biochemistry. .

Abstract

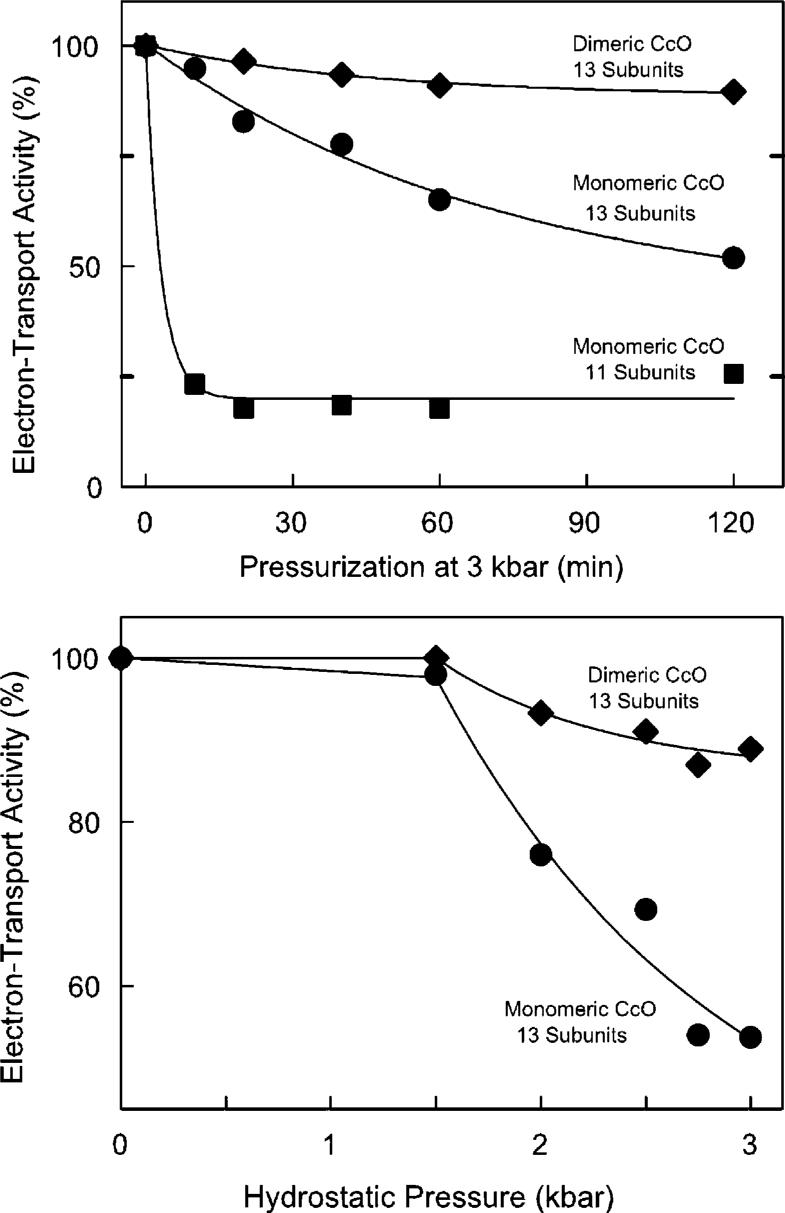
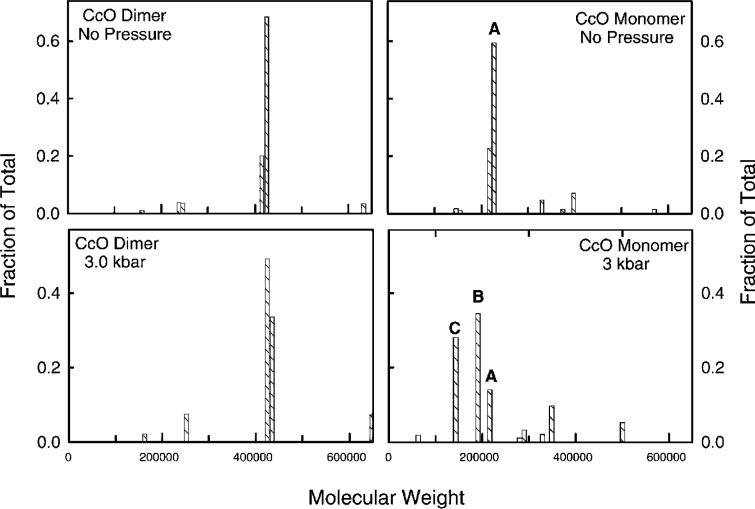
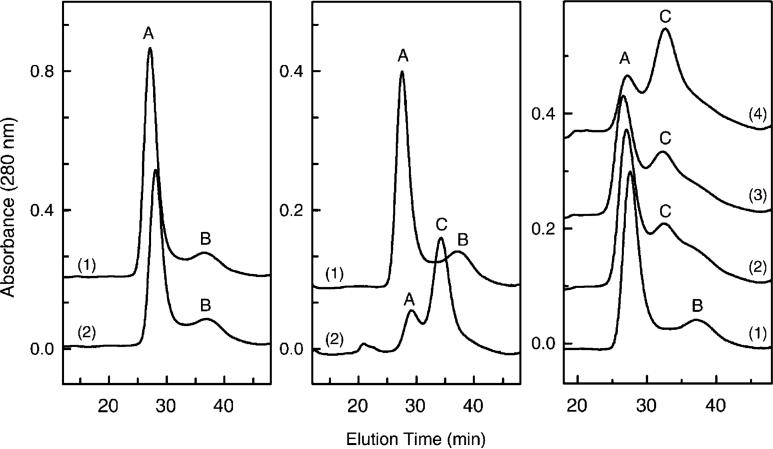
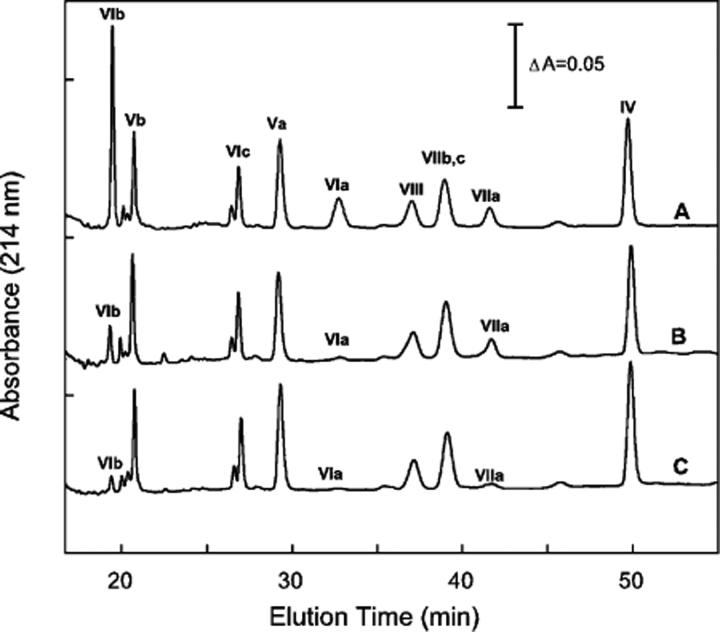
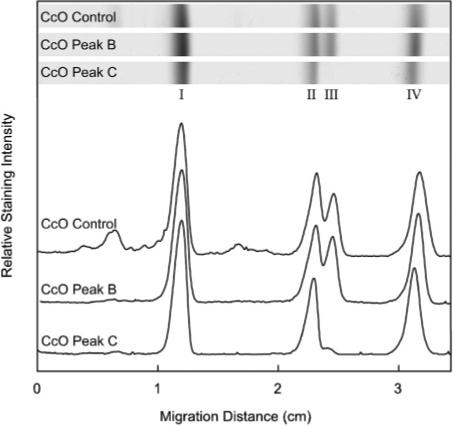
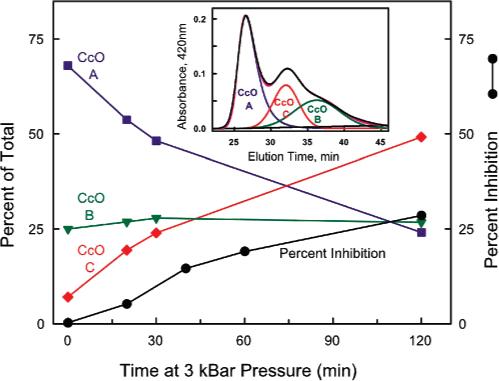
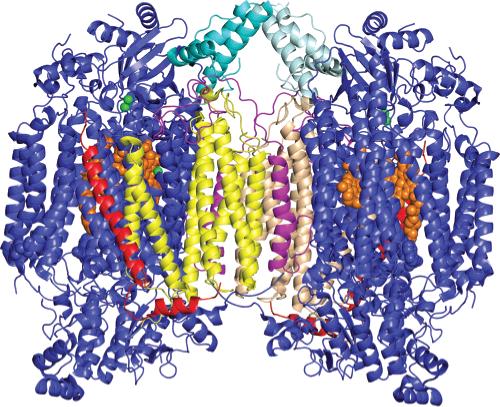
Detergent-solubilized dimeric and monomeric cytochrome c oxidase (CcO) have significantly different quaternary stability when exposed to 2-3 kbar of hydrostatic pressure. Dimeric, dodecyl maltoside-solubilized cytochrome c oxidase is very resistant to elevated hydrostatic pressure with almost no perturbation of its quaternary structure or functional activity after release of pressure. In contrast to the stability of dimeric CcO, 3 kbar of hydrostatic pressure triggers multiple structural and functional alterations within monomeric cytochrome c oxidase. The perturbations are either irreversible or slowly reversible since they persist after the release of high pressure. Therefore, standard biochemical analytical procedures could be used to quantify the pressure-induced changes after the release of hydrostatic pressure. The electron transport activity of monomeric cytochrome c oxidase decreases by as much as 60% after exposure to 3 kbar of hydrostatic pressure. The irreversible loss of activity occurs in a time- and pressure-dependent manner. Coincident with the activity loss is a sequential dissociation of four subunits as detected by sedimentation velocity, high-performance ion-exchange chromatography, and reversed-phase and SDS-PAGE subunit analysis. Subunits VIa and VIb are the first to dissociate followed by subunits III and VIIa. Removal of subunits VIa and VIb prior to pressurization makes the resulting 11-subunit form of CcO even more sensitive to elevated hydrostatic pressure than monomeric CcO containing all 13 subunits. However, dimeric CcO, in which the association of VIa and VIb is stabilized, is not susceptible to pressure-induced inactivation. We conclude that dissociation of subunit III and/or VIIa must be responsible for pressure-induced inactivation of CcO since VIa and VIb can be removed from monomeric CcO without significant activity loss. These results are the first to clearly demonstrate an important structural role for the dimeric form of cytochrome c oxidase, i.e., stabilization of its quaternary structure.


Figures

Figure 1
Figure 1
Hydrostatic pressure-induced inactivation of cytochrome c oxidase. The electron transfer activity of dimeric (◆), 13-subunit monomeric (◆), and 11-subunit monomeric CcO (■) was measured as a function of exposure time to 3 kbar of hydrostatic pressure (top) and as a function of hydrostatic pressure treatment for 2 h (bottom). The three data sets were fitted with single-term exponentials. The fitting parameters at infinite time were 88, 40, and 20% for dimeric, monomeric, and 11-subunit CcO, respectively. In each case, 8 μM aa3 was exposed to hydrostatic pressure at 25 °C in 20 mM Tris-SO4 buffer (pH 7.4) containing the following amount of detergent: 2 mM DM and 2 mM sodium cholate for dimeric CcO; 10 mM DM for 13-subunit, monomeric CcO; and 2 mM DM for 11-subunit CcO. Electron transfer activity of each sample was measured after decompression and dilution into dodecyl maltoside-containing assay buffer. Data are reproducible to ±5% based upon more than a dozen repetitions of each pressure-induced inactivation curve using four different preparations of CcO.
Figure 2
Figure 2
Protein molecular weight distributions for dimeric and monomeric CcO before and after exposure to 3 kbar of hydrostatic pressure. In the left panels are protein molecular weight distributions for dimeric CcO before (top) and after (bottom) pressurization at 3 kbar for 2 h. In the right panels are protein molecular mass distributions for 13-subunit monomeric CcO before (top) and after (bottom) pressurization at 3 kbar for 2 h. The histogram bars labeled A, B, and C are CcO subcomplexes for which Mw ≅ 205 000, 190 000, 150 000, respectively. Sedimentation velocity data for CcO were acquired at 420 nm during sedimentation at 40 000 rpm. Duplicate samples were analyzed and gave nearly identical results. Data were analyzed by the C(s) procedure (21), which generates a distribution of s20,w and D20,w for each sample based upon a single value for f/fo. The two coefficients are used to evaluate a distribution of protein molecular weights assuming a constant amount of bound detergent (δdet). The analysis procedure for each CcO sample involved use of the following values for these constants: δdet = 0.30 and f/fo = 1.33 for dimeric CcO before pressurization and δdet = 0.30 and f/fo = 1.35 for dimeric CcO after pressurization; δdet = 0.40 and f/fo = 1.31 for 13-subunit CcO before pressurization and δdet = 0.40 and f/fo = 1.20 for 13-subunit CcO after pressurization. The smaller f/fo value for monomeric CcO after pressurization most likely was due to the influence of the smaller subcomplexes of CcO. Pressurization conditions were identical to those described in the legend of Figure 1.
Figure 3
Figure 3
Separation of CcO subcomplexes by HiTrapQ FPLC anion-exchange chromatography. The left panel depicts the elution of dimeric CcO before (1) and after (2) pressurization at 3 kbar for 2 h. The middle panel depicts the elution of monomeric CcO before (1) and after (2) pressurization at 3 kbar for 2 h. The right panel depicts the elution of monomeric CcO as a function of time at 3 kbar pressure: (1) 0, (2) 20, (3) 30, and (4) 120 min. Elution and gradient conditions are identical to those previously described (18). Nearly identical elution profiles were obtained each time pressure-treated CcO was analyzed (experiment repeated more than a dozen times).
Figure 4
Figure 4
Reversed-phase HPLC analysis of nuclear-encoded subunits of CcO and its pressure-generated subcomplexes. Monomeric CcO, after exposure to 3 kbar of hydrostatic pressure for 2 h, was separated by HiTrapQ anion-exchange chromatography into three distinct chromatographic species, i.e., A, B, and C in Figure 3, and the subunit content of each was determined by quantitative reversed-phase HPLC analysis (27). Nearly identical subunit compositions were obtained each time the HiTrapQ peaks were analyzed. Data are representative of more than a dozen analyses: (A) subunit content of HiTrapQ peak A, (B) subunit content of HiTrapQ peak B, and (C) subunit content of HiTrapQ peak C. For each analysis, CcO eluting in a HiTrapQ peak was pooled, acidified with 0.2% TFA, and 50−100 μg of protein injected onto the RP-HPLC column.
Figure 5
Figure 5
SDS–PAGE analysis of mitochondrially encoded subunits of CcO and its pressure-generated subcomplexes. Monomeric CcO, after exposure to 3 kbar of hydrostatic pressure for 2 h, was separated by HiTrapQ anion-exchange chromatography into three distinct chromatographic species, i.e., A, B, and C as described in the legend of Figure 4. The subunit content of CcO eluting in peaks B and C was compared to the subunit content of CcO that had not been exposed to hydrostatic pressure (CcO Control), which is identical to CcO peak A (27). The relative amounts of subunits I–IV in each sample were determined by SDS–PAGE using a 15% running gel that contained 2 M urea and 0.1% SDS. Gels were stained, destained, and scanned as described in Experimental Procedures. Data are representative of analyses done in triplicate.
Figure 6
Figure 6
Correlation between pressure-induced inactivation of CcO and the generation of a 9-subunit subcomplex of CcO. The relative amounts corresponding to CcO-A (13 subunits), CcO-B (11 subunits), and CcO-C (9 subunits) are plotted in the main figure as a function of pressurization time at 3 kbar. The generation of CcO peak C, i.e., CcO-C containing only 9 subunits (red line), correlates well with the percent loss of enzymatic activity (black line). These data were generated by measuring the electron transfer activity of CcO and the percent of the three forms of CcO, i.e., CcO-A (13 subunits), CcO-B (11 subunits), and CcO-C (9 subunits), as a function of exposure time at 3 kbar of hydrostatic pressure. To obtain the percent CcO-A, CcO-B, and CcO-C, the data depicted in Figure 3 (right panel) were quantified by fitting each elution profile to three slightly skewed gaussians. The inset illustrates such an analysis for the elution of CcO after it was exposed to 3 kbar of hydrostatic pressure for 30 min. The three gaussians fit the original elution profile (black line) very well. The relative amounts corresponding to CcO-A (13 subunits), CcO-B (11 subunits), and CcO-C (9 subunits) were calculated from their respective areas under each gaussian.
Figure 7
Figure 7
Three-dimensional structure of dimeric CcO illustrating the location of the four subunits that dissociate during exposure to hydrostatic pressure: yellow and tan for subunit III, magenta for subunit VIa, light and dark teal for subunit VIb, red for subunit VIIa, orange for heme a and a3, and green for CuA and CuB. All other subunits are colored blue. Subunits VIa and VIb are the first subunits to dissociate during pressurization of CcO. In the CcO dimer, both of these subunits are “trapped” at the dimer interface, preventing their dissociation. In monomeric CcO, this constraint is removed, enabling both subunits to dissociate and produce CcO-B, an 11-subunit complex of CcO. Subsequent to the dissociation of subunits VIa and VIb is the dissociation of subunits III and VIIa. Subunit III is located at the dimer interface, and its association is also stabilized by CcO dimerization. This figure was prepared using PyMol (DeLano Scientific LLC, San Francisco, CA) using atomic coordinates of CcO [PDB entry 1v54 (1)].

References

    1. Tsukihara T, Aoyama H, Yamashita E, Tomizaki T, Yamaguchi H, Shinzawa-Itoh K, Nakashima R, Yaono R, Yoshikawa S. The whole structure of the 13-subunit oxidized cytochrome c oxidase at 2.8 Å. Science. 1996;272:1136–1144. - PubMed
    1. Kadenbach B, Jarausch J, Hartmann R, Merle P. Separation of mammalian cytochrome c oxidase into 13 polypeptides by sodium dodecyl sulfate-gel electrophoresis procedure. Anal. Biochem. 1983;129:517–521. - PubMed
    1. Robinson NC. Functional binding of cardiolipin to cytochrome c oxidase. J. Bioenerg. Biomembr. 1993;25:153–163. - PubMed
    1. Suarez MD, Revzin A, Narlock R, Kempner ES, Thompson DA, Ferguson-Miller S. The functional and physical form of mammalian cytochrome c oxidase determined by gel filtration, radiation inactivation, and sedimentation equilibrium analysis. J. Biol. Chem. 1984;259:13791–13799. - PubMed
    1. Robinson NC, Talbert L. Triton X-100 induced dissociation of beef heart cytochrome c oxidase into monomers. Biochemistry. 1986;25:2328–2335. - PubMed

Publication types