. 2007 May;3(5):e95.
doi: 10.1371/journal.pcbi.0030095.

The emergence of alternative 3' and 5' splice site exons from constitutive exons

Affiliations

The emergence of alternative 3' and 5' splice site exons from constitutive exons

Eli Koren et al. PLoS Comput Biol. 2007 May.

Abstract

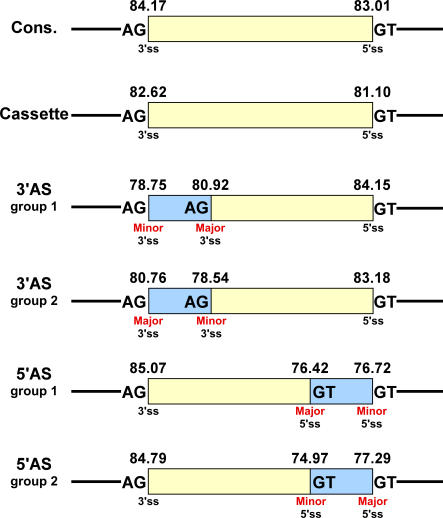
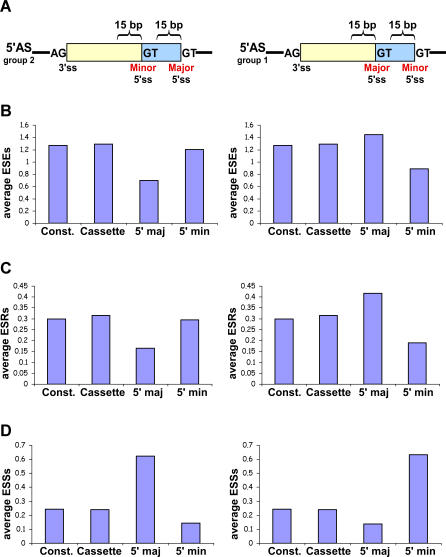
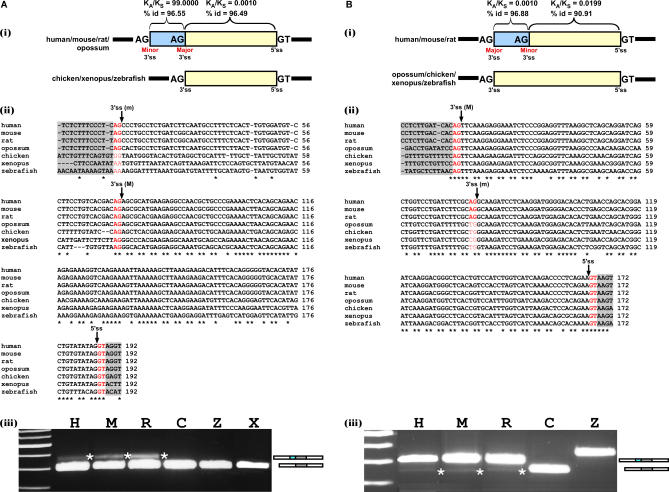
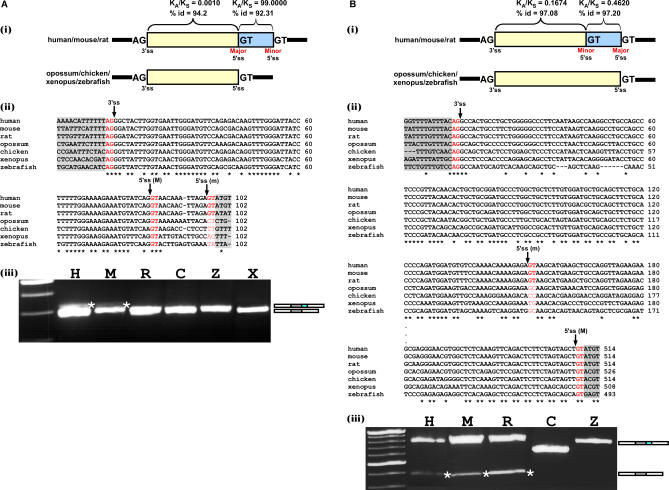
Alternative 3' and 5' splice site (ss) events constitute a significant part of all alternative splicing events. These events were also found to be related to several aberrant splicing diseases. However, only few of the characteristics that distinguish these events from alternative cassette exons are known currently. In this study, we compared the characteristics of constitutive exons, alternative cassette exons, and alternative 3'ss and 5'ss exons. The results revealed that alternative 3'ss and 5'ss exons are an intermediate state between constitutive and alternative cassette exons, where the constitutive side resembles constitutive exons, and the alternative side resembles alternative cassette exons. The results also show that alternative 3'ss and 5'ss exons exhibit low levels of symmetry (frame-preserving), similar to constitutive exons, whereas the sequence between the two alternative splice sites shows high symmetry levels, similar to alternative cassette exons. In addition, flanking intronic conservation analysis revealed that exons whose alternative splice sites are at least nine nucleotides apart show a high conservation level, indicating intronic participation in the regulation of their splicing, whereas exons whose alternative splice sites are fewer than nine nucleotides apart show a low conservation level. Further examination of these exons, spanning seven vertebrate species, suggests an evolutionary model in which the alternative state is a derivative of an ancestral constitutive exon, where a mutation inside the exon or along the flanking intron resulted in the creation of a new splice site that competes with the original one, leading to alternative splice site selection. This model was validated experimentally on four exons, showing that they indeed originated from constitutive exons that acquired a new competing splice site during evolution.


Conflict of interest statement

Competing interests. The authors have declared that no competing interests exist.

Figures

Figure 1
Figure 1. Special Characteristics of Alternative 3′ and 5′ Splicing Sites
Human–mouse conserved 3′ and 5′ alternative splicing events (A3Es and A5Es, respectively) were divided into two subgroups according to their relative usage, in which the alternative splice site that is supported by most EST/cDNA is called Major, whereas the less-selected site is the Minor (see Materials and Methods). Splice site score of the 3′ and 5′ splice sites of constitutive, cassette (exon skipping), alternative 3′, and alternative 5′ exons was calculated using the “Analyzer Splice Tool” server (http://ast.bioinfo.tau.ac.il/SpliceSiteFrame.htm). Human exon scores are shown above the exon/intron junction scheme (see Figure S1 for mouse scores). Major/Minor splice site is indicated below each splice site. Exon sequence is represented by a yellow box and the alternative sequence (extension) by a light blue box. Introns are represented by black lines; canonical splice sites are shown in bold.
Figure 2
Figure 2. ESRs Analysis of Human–Mouse Conserved Alternative 5′ss Events
A region 15 bp upstream of the major (5′ maj) and minor (5′ min) 5′ss was screened for ESRs. Average ESR number was calculated for each region. The analysis was performed for human–mouse conserved 5′ alternative splicing events that were divided into two subgroups according to their major/minor forms and the results were compared with constitutive (Const.) and alternative cassette conserved exons. Left and right panels are “group 2” (major form is longer than minor form) and “group 1” (major form is shorter than minor form) A5Es, respectively. (A) Schematic illustration of the analysis conducted. (B) Average ESEs [36]. (C) Average ESRs [10]. (D) Average ESSs [37].
Figure 3
Figure 3. Flanking Introns Conservation
Alignment of flanking intron regions was performed using the local alignment program Sim4 for upstream and downstream flanking intron (left and right panel, respectively). The x-axis represents the identity length (bp) and the y-axis represents the percentage of introns that were found to have an identity in that length or higher. (A) Conservation level of flanking introns for constitutive (blue circle), cassette (pink square), alt 3′ss (light blue diamond), and alt 5′ss (dark red triangle) exons. (B) Conservation analysis combined with division of the A3Es and A5Es into two subgroups according to their extension length (8 bp and less versus 9 bp and more). Analysis for the two subgroups is presented for the upstream intron of A3Es (light blue and light green diamonds) and for the downstream intron of A5Es (dark red and light green triangles).
Figure 4
Figure 4. Mutations That Introduced a New Competing 3′ss Shifted Splicing from Constitutive to Alternative During Evolution
Multiple alignment of homolog exons and flanking intronic sequences among seven vertebrate species was constructed according to a known evolutionary tree (see Table S1A for the sequences accessions) using ClustalW ([46]; http://www.ebi.ac.uk/clustalw). (A,B) The analysis was conducted on “group 1” and “group 2” alternative 3′ss exons, respectively. In the top panel (i) is a schematic representation of the handled exon. Exon sequence is represented by a yellow box and the alternative sequence (extension) by a light blue box. Introns are represented by black lines. The human–mouse KA/KS values and identity percentage are shown above the boxes. Major and minor splice site is indicated below the boxes as well. The organisms that have a potential (according to their splice site content) to have either both alternatively spliced forms or only one of the forms are shown on the left of the schema. In the middle panel (ii) is a multiple alignment, among the seven species, of the exon and flanking 3′ and 5′ splice sites. The major 3′ss (M), minor 3′ss (m), and 5′ss are marked in red and pointed to by an arrow. Intronic regions are highlighted in light grey. On the bottom panel (iii) is an RT–PCR analysis on normal brain cDNA of human, mouse, and rat (H, M, and R, respectively), chicken 5-d embryo (C), adult zebrafish whole body (Z), and xenopus oocytes (X). PCR products were amplified using species-specific primers, and splicing products were separated on a 3% agarose gel and sequenced. Asterisks point to the alternative isoform; an illustration of both alternative isoforms is shown on the right by grey, cyan, and white boxes (alternative exon, extension, and flanking exons, respectively).
Figure 5
Figure 5. Mutations That Introduced a New Competing 5′ss Shifted Splicing from Constitutive to Alternative during Evolution
Multiple alignment of homolog exons and flanking intronic sequences among seven vertebrate species was constructed according to a known evolutionary tree (see Table S1B for the sequences accessions) using ClustalW ([46]; http://www.ebi.ac.uk/clustalw). (A,B) The analysis was conducted on “group 1” and “group 2” alternative 5′ss exons, respectively. In the top panel (i) is a schematic representation of the handled exon. Exon sequence is represented by a yellow box and the alternative sequence (extension) by a light blue box. Introns are represented by black lines. The human–mouse KA/KS values and identity percentage are shown above the boxes. Major and minor splice site is indicated below the boxes as well. The organisms that have a potential (according to their splice site content) to have either both alternatively spliced forms or only one of the forms are shown on the left of the schema. In the middle (ii) panel is a multiple alignment, among the seven species, of the exon and flanking 3′ and 5′ splice sites. The major 5′ss (M), minor 5′ss (m), and 3′ss are marked in red and pointed to by an arrow. Intronic regions are highlighted in light grey. On the bottom panel (iii) is an RT–PCR analysis on normal brain cDNA of human, mouse, and rat (H, M, and R, respectively), chicken 5-d embryo (C), adult zebrafish whole body (Z), and xenopus oocytes (X). PCR products were amplified using species-specific primers, and splicing products were separated on a 3.5% agarose gel and sequenced. Asterisks point to the alternative isoform; an illustration of both alternative isoforms is shown on the right by grey, cyan, and white boxes (alternative exon, extension, and flanking exons, respectively).

References

    1. Consortium TCeS. Genome sequence of the nematode C. elegans: A platform for investigating biology. Science. 1998;282:2012–2018. - PubMed
    1. Lander ES, Linton LM, Birren B, Nusbaum C, Zody MC, et al. Initial sequencing and analysis of the human genome. Nature. 2001;409:860–921. - PubMed
    1. Graveley BR. Alternative splicing: Increasing diversity in the proteomic world. Trends Genet. 2001;17:100–107. - PubMed
    1. Hastings ML, Krainer AR. Pre-mRNA splicing in the new millennium. Curr Opin Cell Biol. 2001;13:302–309. - PubMed
    1. Kim E, Magen A, Ast G. Different levels of alternative splicing among eukaryotes. Nucleic Acids Res. 2007;35:125–131. - PMC - PubMed

Publication types

MeSH terms