. 2007 Jun;40(3):367-80.
doi: 10.1111/j.1365-2184.2007.00439.x.

Directed engineering of umbilical cord blood stem cells to produce C-peptide and insulin

Affiliations

Directed engineering of umbilical cord blood stem cells to produce C-peptide and insulin

L Denner et al. Cell Prolif. 2007 Jun.

Abstract

Objectives: In this study, we investigated the potential of umbilical cord blood stem cell lineages to produce C-peptide and insulin.

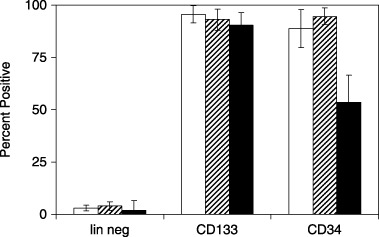
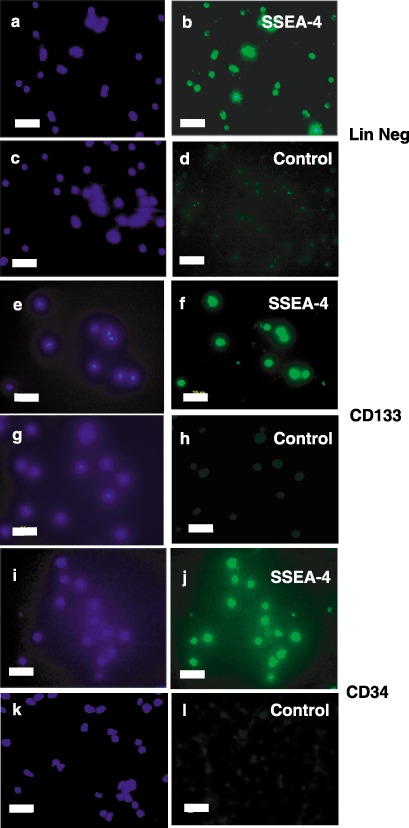
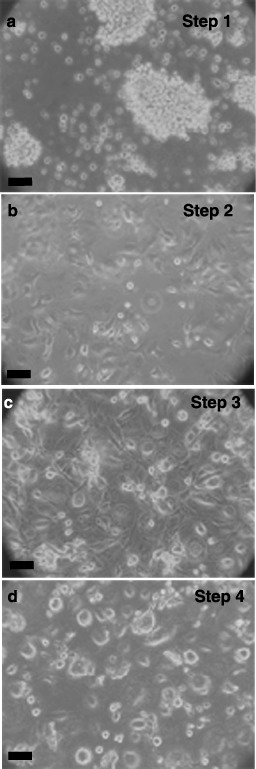
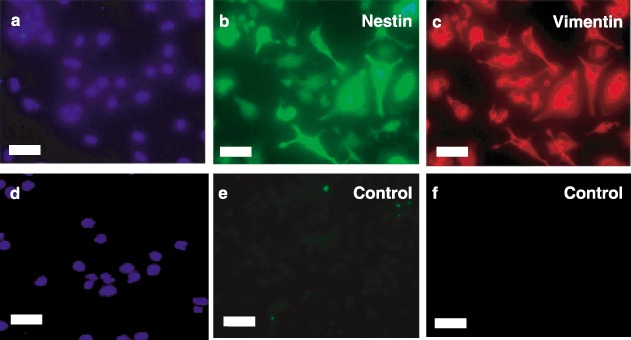
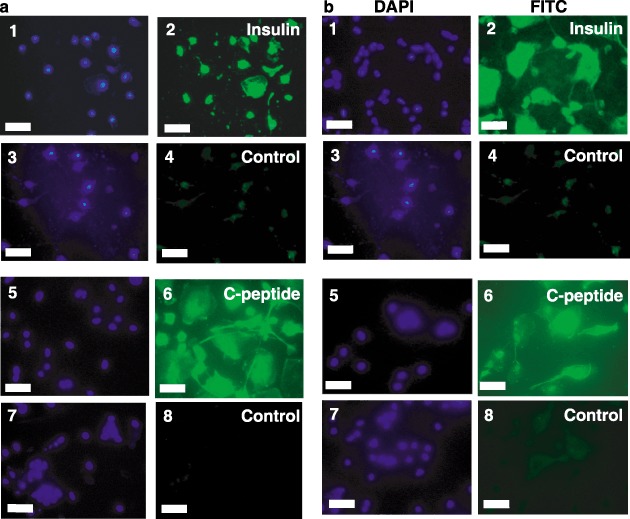
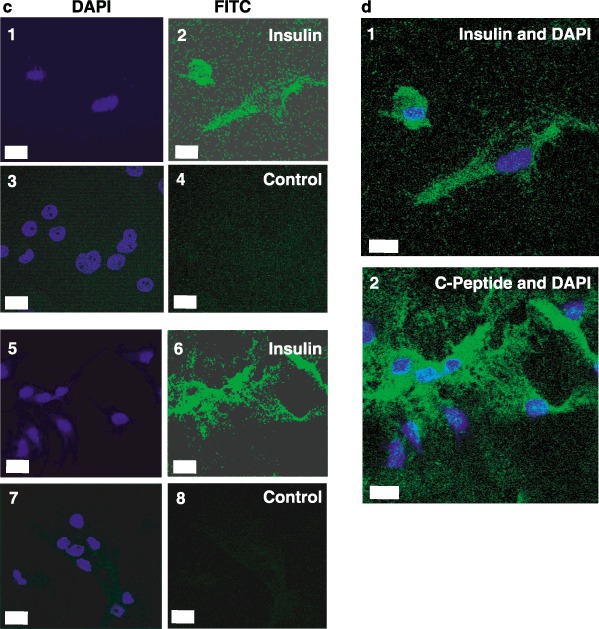
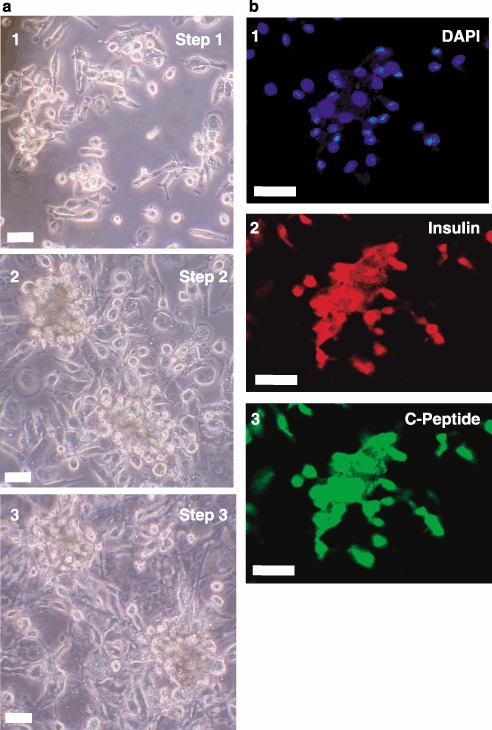
Materials and methods: Lineage negative, CD133+ and CD34+ cells were analyzed by flow cytometry to assess expression of cell division antigens. These lineages were expanded in culture and subjected to an established protocol to differentiate mouse embryonic stem cells (ESCs) toward the pancreatic phenotype. Phase contrast and fluorescence immunocytochemistry were used to characterize differentiation markers with particular emphasis on insulin and C-peptide.

Results: All 3 lineages expressed SSEA-4, a marker previously reported to be restricted to the ESC compartment. Phase contrast microscopy showed all three lineages recapitulated the treatment-dependent morphological changes of ESCs as well as the temporally restricted expression of nestin and vimentin during differentiation. After engineering, each isolate contained both C-peptide and insulin, a result also obtained following a much shorter protocol for ESCs.

Conclusions: Since C-peptide can only be derived from de novo synthesis and processing of pre-proinsulin mRNA and protein, we conclude that these results are the first demonstration that human umbilical cord blood-derived stem cells can be engineered to engage in de novo synthesis of insulin.


Figures

Figure 1
Figure 1
Flow cytometry analysis of lineages from umbilical cord blood stem cells. Freshly isolated stem cells from the indicated lineages were analyzed by flow cytometry for expression of CD133 (open bars), CD34 (horizontal hatched bars) and CD38 (filled bars). Data represent means and standard errors of the mean for at least three independent isolations.
Figure 2
Figure 2
Immunocytochemical characterization of SSEA‐4 expression in stem cell lineages. Freshly isolated lineage negative (Panels a–d), CD133+ (Panels e–h) or CD34+ (Panels i–l) cells were stained with antihuman SSEA‐4 immunoglobulin G (IgG) (Panels b, f and j) or control IgG (Panels d, h and l) followed by fluorescein isothiocyanate (FITC)‐conjugated second antibodies (Panels b, d, f, h, j and l). Nuclei were then visualized by staining with 4′,6‐diamidino‐2‐phenylindole (DAPI) (Panels a, c, e, g, i and k). Fluorescence micrographs are representative of at least three independent isolations. Scale bars, 25 µm.
Figure 3
Figure 3
Differentiation of cord blood stem cells. Lineage‐negative cells were expanded for 1 week and then differentiated as described in ‘Methods’ and cell morphology shown with phase contrast microscopy. Step 1 (4 days, Panel a), aggregation in differentiation medium. Step 2 (6 days, Panel b), production of nestin‐positive, attached cells in serum‐free medium. Step 3 (6 days, Panel c), proliferation towards pancreatic lineage with basic fibroblast growth factor (bFGF). Step 4 (6 days, Panel d), differentiation to insulin‐ and C‐peptide‐containing cells by nicotinamide. Phase contrast micrographs are representative of at least five experiments. Scale bars, 25 µm.
Figure 4
Figure 4
Immunocytochemical characterization of nestin and vimentin expression. Lineage‐negative stem cells after serum‐free induced attachment in Step 2 were fixed and stained with antihuman nestin IgG (Panel b), antihuman vimentin immunoglobulin G (IgG) (Panel c) or control IgG (Panels e and f). Cells were then exposed to fluorescein isothiocyanate (FITC) (Panels b and e) – or Texas Red (Panels c and f) – conjugated secondary antibodies and nuclei stained with 4′,6‐diamidino‐2‐phenylindole (DAPI) (Panels a and d). Fluorescent micrographs are representative of at least three experiments. Scale bars, 25 µm.
Figure 5
Figure 5
Insulin and C‐peptide staining of differentiated stem cells. CD34+ (Panel a), CD133+ (Panel b) and lineage‐negative (Panel c) cells were differentiated as described in ‘Methods.’ Cells were stained with anti‐insulin immunoglobulin G (IgG) (subpanel 2), anti‐C‐peptide IgG (subpanel 6), or control IgGs followed by fluorescein isothiocyanate (FITC)‐conjugated secondary antibodies (subpanels 4 and 8). Nuclei were then stained with 4′,6‐diamidino‐2‐phenylindole (DAPI) (subpanels 1, 3, 5 and 7). Images were captured by fluorescence microscopy (Panels A and B; Scale bars, 25 µm) or laser scanning confocal microscopy (Panel c; Scale bars, 10 µm). Merged images of DAPI and insulin (Panel d, subpanel 1) or DAPI and C‐peptide (Panel d, subpanel 2) were captured by laser scanning confocal microscopy (Scale bars, 10 µm). Micrographs are representative of at least three experiments.
Figure 5
Figure 5
Insulin and C‐peptide staining of differentiated stem cells. CD34+ (Panel a), CD133+ (Panel b) and lineage‐negative (Panel c) cells were differentiated as described in ‘Methods.’ Cells were stained with anti‐insulin immunoglobulin G (IgG) (subpanel 2), anti‐C‐peptide IgG (subpanel 6), or control IgGs followed by fluorescein isothiocyanate (FITC)‐conjugated secondary antibodies (subpanels 4 and 8). Nuclei were then stained with 4′,6‐diamidino‐2‐phenylindole (DAPI) (subpanels 1, 3, 5 and 7). Images were captured by fluorescence microscopy (Panels A and B; Scale bars, 25 µm) or laser scanning confocal microscopy (Panel c; Scale bars, 10 µm). Merged images of DAPI and insulin (Panel d, subpanel 1) or DAPI and C‐peptide (Panel d, subpanel 2) were captured by laser scanning confocal microscopy (Scale bars, 10 µm). Micrographs are representative of at least three experiments.
Figure 6
Figure 6
Insulin and C‐peptide staining after a 9‐day differentiation protocol. Phase contrast microscopy is shown in Panel (a) for lineage‐negative cells treated with Activin A followed by retinoic acid (Step 1, subpanel 1), basic fibroblast growth factor (bFGF) (Step 2, subpanel 2) and finally, laminin, nicotinamide and bFGF (Step 3, subpanel 3). Differentiated cells were visualized by fluorescence immunocytochemistry in Panel (b) for insulin (subpanel 2) and C‐peptide (subpanel 3). Nuclei were stained with 4’,6‐diamidino‐2‐phenylindole (DAPI) (subpanel 1). Micrographs are representative of three experiments. Scale bars, 25 µm.

References

    1. Abuljadayel IS (2003) Induction of stem cell‐like plasticity in mononuclear cells derived from unmobilised adult human peripheral blood. Curr. Med. Res. Opin. 19, 355–375. - PubMed
    1. Ali NN, Edgar AJ, Samadikuchaksaraei A, Timson CM, Romanska HM, Polak JM, Bishop AE (2002) Derivation of type II alveolar epithelial cells from murine embryonic stem cells. Tissue Eng. 8, 541–550. - PubMed
    1. Blyszczuk P, Asbrand C, Rozzo A, Kania G, St‐Onge L, Rupnik M, Wobus AM (2004) Embryonic stem cells differentiate into insulin‐producing cells without selection of nestin‐expressing cells. Int. J. Dev Biol. 48, 1095–1104. - PubMed
    1. Blyszczuk P, Wobus AM (2004) Stem cells and pancreatic differentiation in vitro . J. Biotechnol. 113, 3–13. - PubMed
    1. Bock T (2004) The source (S) for new pancreatic beta cells in adult life. Bioessays 26, 1156–1159. - PubMed

Publication types