. 2007;8(5):R91.
doi: 10.1186/gb-2007-8-5-r91.

Gene expression variation in Down's syndrome mice allows prioritization of candidate genes

Affiliations

Gene expression variation in Down's syndrome mice allows prioritization of candidate genes

Marc Sultan et al. Genome Biol. 2007.

Abstract

Background: Down's syndrome (DS), or trisomy 21, is a complex developmental disorder that exhibits many clinical signs that vary in occurrence and severity among patients. The molecular mechanisms responsible for DS have thus far remained elusive. We argue here that normal variation in gene expression in the population contributes to the heterogeneous clinical picture of DS, and we estimated the amplitude of this variation in 50 mouse orthologs of chromosome 21 genes in brain regions of Ts65Dn (a mouse model of DS). We analyzed the RNAs of eight Ts65Dn and eight euploid mice by real-time polymerase chain reaction.

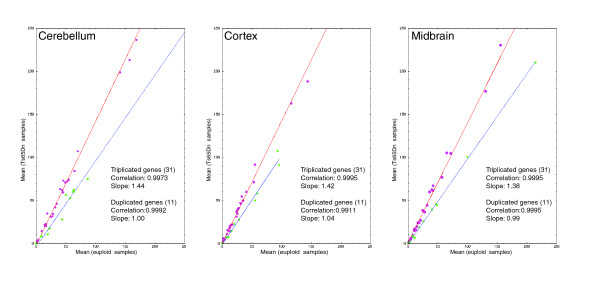
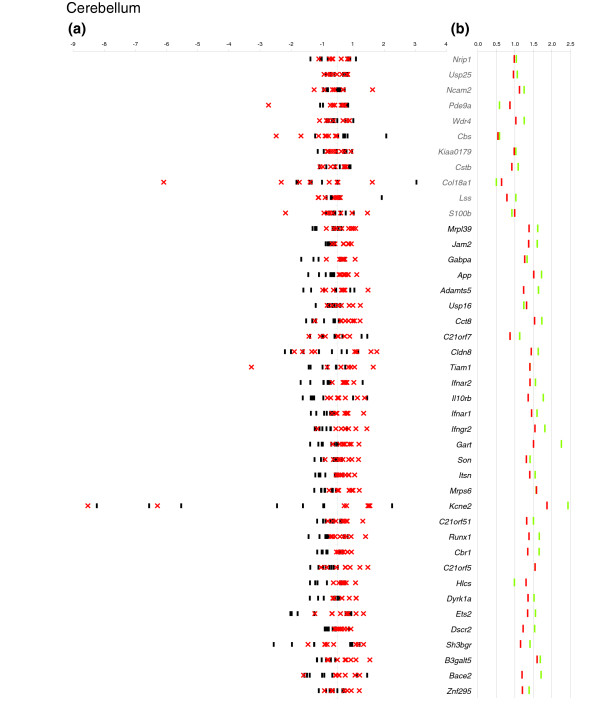
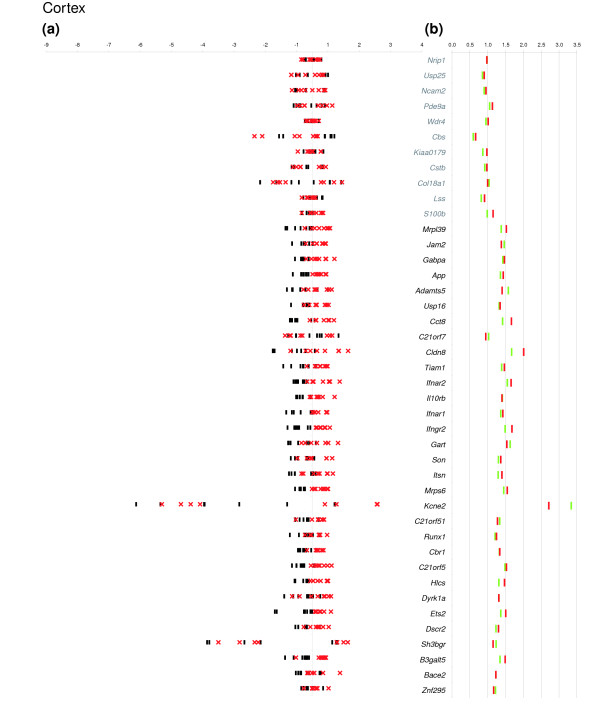
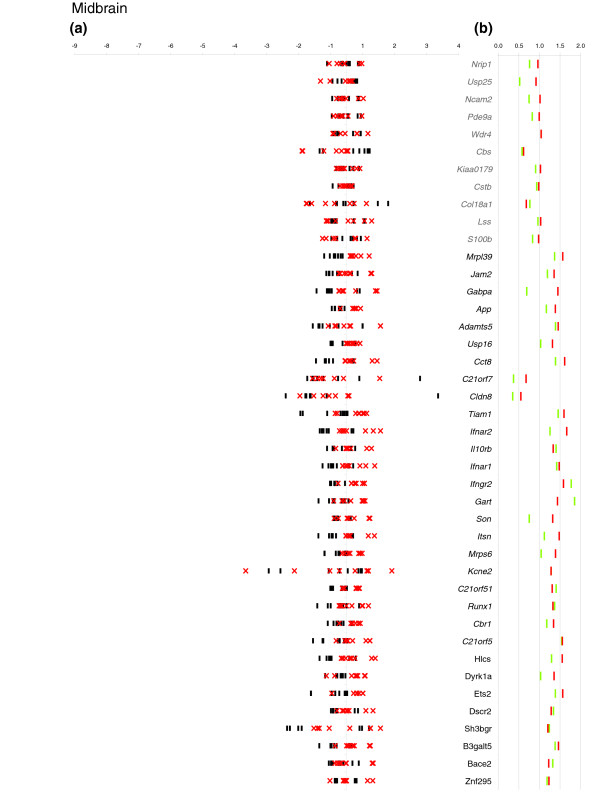
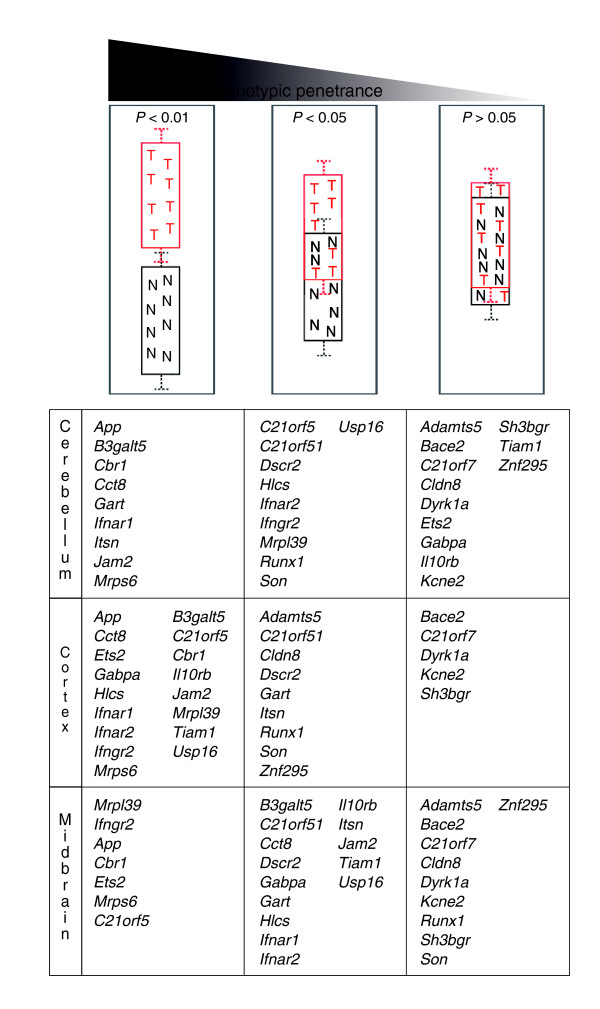
Results: In pooled RNAs, we confirmed that trisomic/euploid gene expression ratios were close to 1.5. However, we observed that inter-individual gene expression levels spanned a broad range of values. We identified three categories of genes: genes with expression levels consistently higher in Ts65Dn than in euploids (9, 17, and 7 genes in cerebellum, cortex, and midbrain, respectively); genes whose expression levels partially overlap between the two groups (10, 9, and 14 genes); and genes with intermingled expression, which cannot be used to differentiate trisomics from euploids (12, 5 and 9 genes). Of the genes in the first category, App, Cbr1, and Mrps6 exhibited tight regulation in the three tissues and are therefore attractive candidates for further research.

Conclusion: This is the first analysis addressing inter-individual gene expression levels as a function of trisomy. We propose a strategy allowing discrimination between candidates for the constant features of DS and those genes that may contribute to the partially penetrant signs of DS.


Figures

Figure 1
Figure 1
Linear regression plots comparing trisomic and control animals. For each plot corresponding to a given tissue, the linear regression for the triplicated genes is in red, and that for the duplicated genes is in blue. Each gene was plotted using the average of its normalized expressions obtained from the individuals of a group (Ts65Dn on the y-axis and euploid on the x-axis).
Figure 2
Figure 2
Relative expression and mean Ts65Dn/euploid ratio plots in cerebellum. (a) For each of eight Ts65Dn mice (red crosses) and eight euploid mice (black dashes), the log2 ratio of the individual normalized expression over the mean expression across all individuals is plotted on the x-axis. When values for different individuals of a given population are very close, they cannot be distinguished on the graph. On the y-axis each expressed gene is represented in chromosomal order. (b) We plotted the mean Ts65Dn/euploid ratios obtained by electronic pooling (red dashes) and the mean Ts65Dn/euploid ratio obtained from a biologic pool (green dashes). The fold changes are given on the x-axis and the gene names on the y-axis. When values for different individuals of a given population are the same, they cannot be distinguished on the graph. Names of genes that are triplicated in Ts65Dn are in bold and disomic genes in grey.
Figure 3
Figure 3
Relative expression and mean Ts65Dn/euploid ratio plots in cortex. (a) For each of eight Ts65Dn mice (red crosses) and eight euploid mice (black dashes), the log2 ratio of the individual normalized expression over the mean expression across all individuals is plotted on the x-axis. When values for different individuals of a given population are very close, they cannot be distinguished on the graph. On the y-axis each expressed gene is represented in chromosomal order. (b) We plotted the mean Ts65Dn/euploid ratios obtained by electronic pooling (red dashes) and the mean Ts65Dn/euploid ratio obtained from a biologic pool (green dashes). The fold changes are given on the x-axis and the gene names on the y-axis. When values for different individuals of a given population are the same, they cannot be distinguished on the graph. Names of genes that are triplicated in Ts65Dn are in bold and disomic genes in grey.
Figure 4
Figure 4
Relative expression and mean Ts65Dn/euploid ratio plots in midbrain. (a) For each of eight Ts65Dn mice (red crosses) and eight euploid mice (black dashes), the log2 ratio of the individual normalized expression over the mean expression across all individuals is plotted on the x-axis. When values for different individuals of a given population are very close, they cannot be distinguished on the graph. On the y-axis each expressed gene is represented in chromosomal order. (b) We plotted the mean Ts65Dn/euploid ratios obtained by electronic pooling (red dashes) and the mean Ts65Dn/euploid ratio obtained from a biologic pool (green dashes). The fold changes are given on the x-axis and the gene names on the y-axis. When values for different individuals of a given population are the same, they cannot be distinguished on the graph. Names of genes that are triplicated in Ts65Dn are in bold and disomic genes in grey.
Figure 5
Figure 5
Gene categorization by phenotype penetrance. Genes are grouped in three categories, according to P value (Wilcoxon test) and the tissues in which they were tested. The first category (left) shows genes with P < 0.01, meaning that the expression levels in Ts65Dn individual mice are consistently different from euploids. The second category shows genes with 0.01 <P < 0.05, for which the expression levels of Ts65Dn samples partially overlap with euploids. The last category (P > 0.05) groups genes for which the expression levels between Ts65Dn and euploid mice cannot be distinguished. Genes in the first category might be responsible for the fully penetrant signs in trisomy, genes in the second could contribute to the variable signs, whereas the third category contains genes that may make little or no contribution.

References

    1. Epstein CJ. Down syndrome (trisomy 21). In: Scriver CRE, editor. The Metabolic and Molecular Bases of Inherited Disease. New York, NY: McGraw-Hill; 1995. pp. 749–794.
    1. Van Cleve SN, Cannon S, Cohen WI. Part II: clinical practice guidelines for adolescents and young adults with Down syndrome: 12 to 21 years. J Pediatr Health Care. 2006;20:198–205. doi: 10.1016/j.pedhc.2006.02.006. - DOI - PubMed
    1. Van Cleve SN, Cohen WI. Part I: clinical practice guidelines for children with Down syndrome from birth to 12 years. J Pediatr Health Care. 2006;20:47–54. doi: 10.1016/j.pedhc.2005.10.004. - DOI - PubMed
    1. Rahmani Z, Blouin JL, Creau-Goldberg N, Watkins PC, Mattei JF, Poissonnier M, Prieur M, Chettouh Z, Nicole A, Aurias A, et al. Critical role of the D21S55 region on chromosome 21 in the pathogenesis of Down syndrome. Proc Natl Acad Sci USA. 1989;86:5958–5962. doi: 10.1073/pnas.86.15.5958. - DOI - PMC - PubMed
    1. Korenberg JR, Chen XN, Schipper R, Sun Z, Gonsky R, Gerwehr S, Carpenter N, Daumer C, Dignan P, Disteche C, et al. Down syndrome phenotypes: the consequences of chromosomal imbalance. Proc Natl Acad Sci USA. 1994;91:4997–5001. doi: 10.1073/pnas.91.11.4997. - DOI - PMC - PubMed

Publication types