

High-content flow cytometry and temporal data analysis for defining a cellular signature of graft-versus-host disease
- PMID: 17531779
- PMCID: PMC2000975
- DOI: 10.1016/j.bbmt.2007.02.002
High-content flow cytometry and temporal data analysis for defining a cellular signature of graft-versus-host disease
Abstract
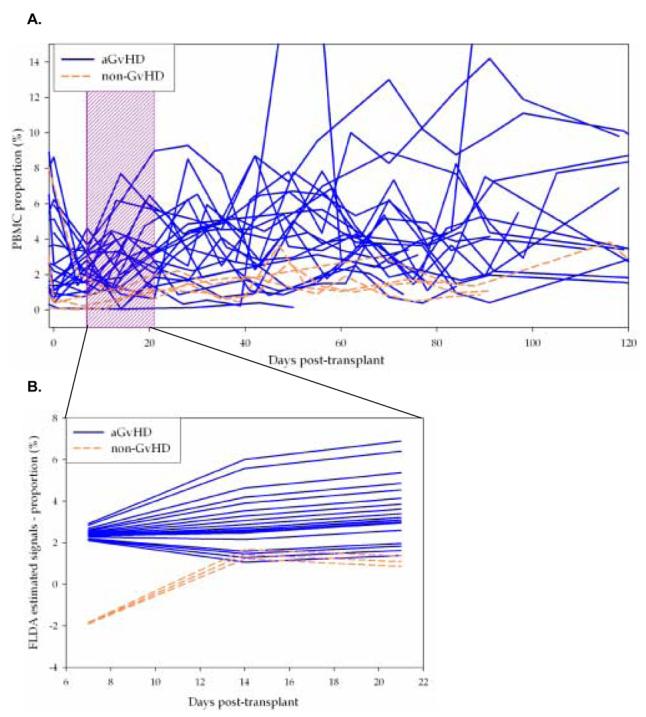
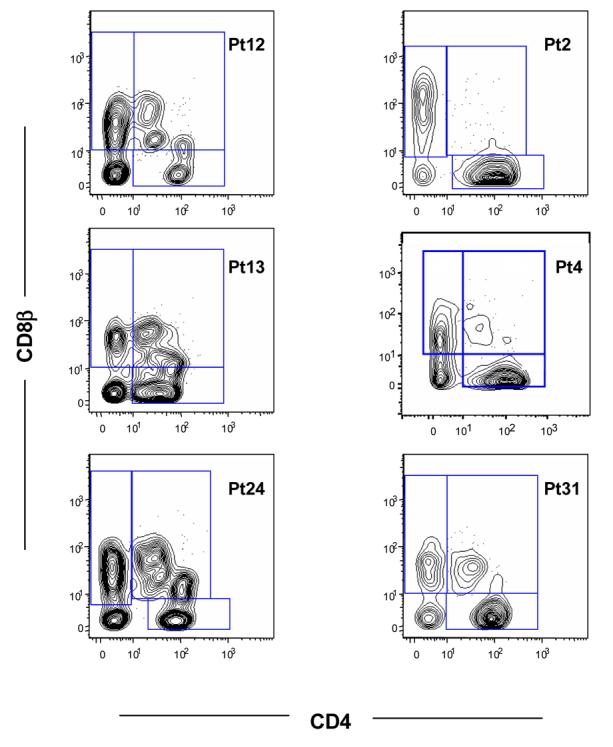
Acute graft-versus-host disease (GVHD) is diagnosed by clinical and histologic criteria that are often nonspecific and typically apparent only after the disease is well established. Because GvHD is mediated by donor T cells and other immune effector cells, we sought to determine whether changes within a wide array of peripheral blood lymphocyte populations could predict the development of GvHD. Peripheral blood samples from 31 patients undergoing allogeneic blood and marrow transplant were analyzed for the proportion of 121 different subpopulations defined by 4-color combinations of lymphocyte phenotypic and activation markers at progressive time points posttransplant. Samples were processed using a newly developed high content flow cytometry technique and subjected to a spline- and functional linear discriminant analysis (FLDA)-based temporal analysis technique. This strategy identified a consistent posttransplant increase in the proportion and extent of fluctuation of CD3+CD4+CD8beta+ cells in patients who developed GVHD compared to those that did not. Although larger prospective clinical studies will be necessary to validate these results, this study demonstrates that high-content flow cytometry coupled with temporal analysis is a powerful approach for developing new diagnostic tools, and may be useful for developing a sensitive and specific predictive test for GVHD.
Figures


References
-
- Chao NJ. Graft-versus-host disease: the viewpoint from the donor T cell. Biology of Blood and Marrow Transplantation. 1997;3:1–10. - PubMed
-
- Couriel D, Caldera H, Champlin R, Komanduri K. Acute graft-versus-host disease: pathophysiology, clinical manifestations, and management. Cancer. 2004;101:1936–1946. - PubMed
-
- Gilliam AC. Update on Graft versus Host Disease. Progress in Dermatology. 2004;123:251–257. - PubMed
-
- Goker H, Haznedaroglu IC, Chao NJ. Acute graft-vs-host disease: pathobiology and management. Experimental Hematology. 2001;29:259–277. - PubMed
-
- Martin PJ, Schoch G, Fisher L, et al. A retrospective analysis of therapy for acute graft-versus-host disease: initial treatment. Blood. 1990;76:1464–1472. - PubMed
Publication types
MeSH terms
Substances
Grants and funding
LinkOut - more resources
Full Text Sources
Research Materials
