. 2007 Oct;83(2):160-8.
doi: 10.1016/j.yexmp.2007.03.003. Epub 2007 Mar 30.

Mallory body formation is associated with epigenetic phenotypic change in hepatocytes in vivo

Affiliations

Mallory body formation is associated with epigenetic phenotypic change in hepatocytes in vivo

Fawzia Bardag-Gorce et al. Exp Mol Pathol. 2007 Oct.

Abstract

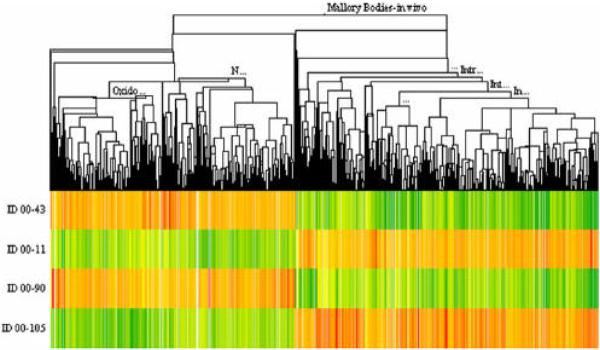
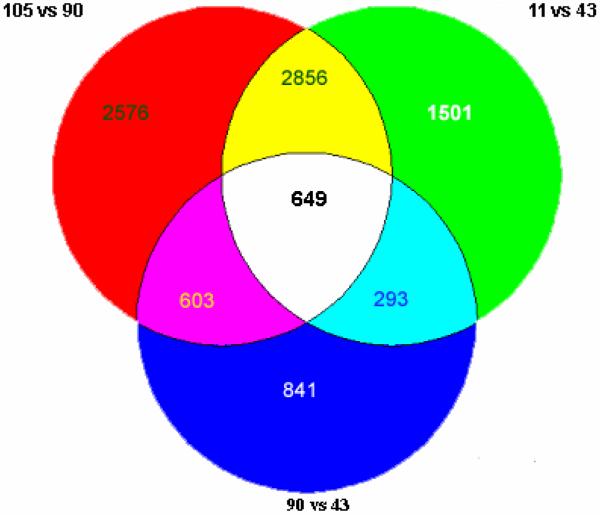
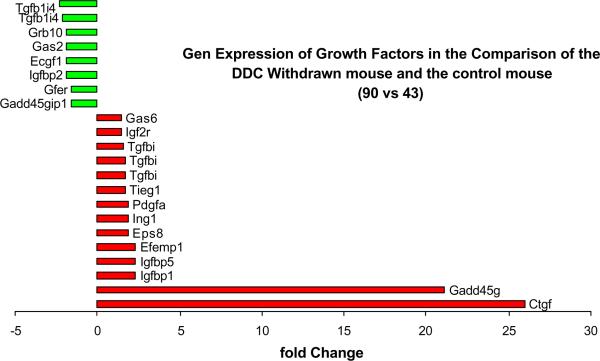
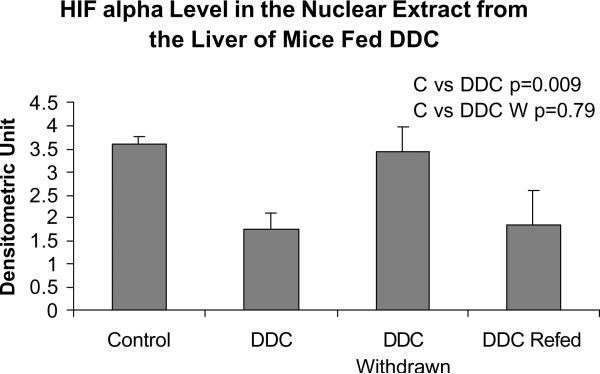
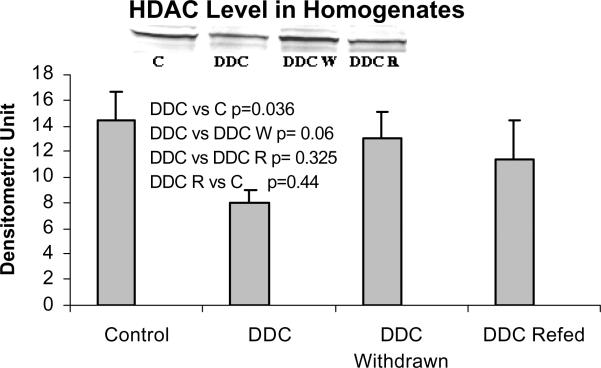
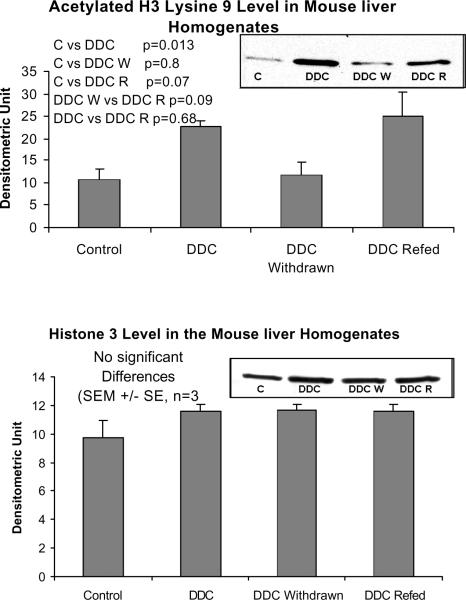
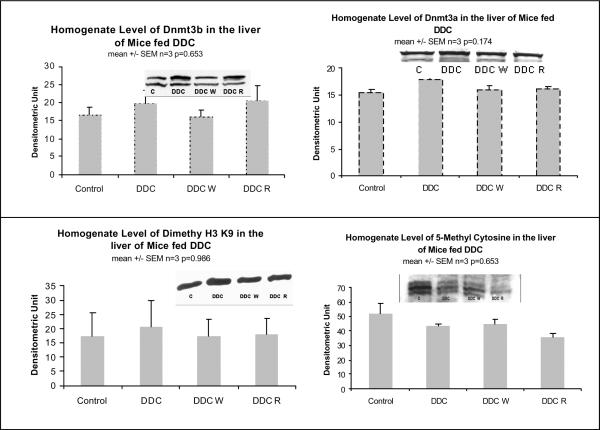
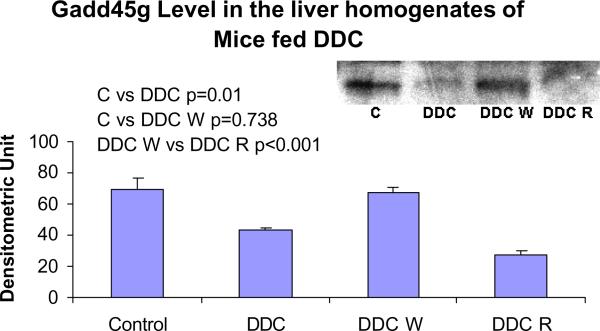
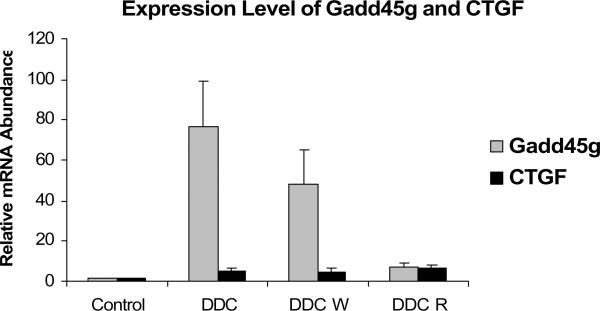
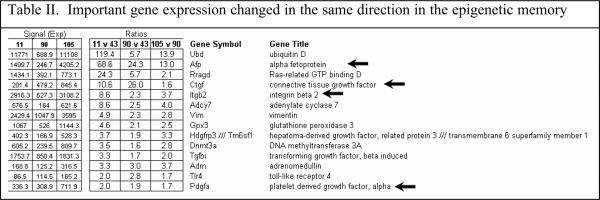
Microarrays were done on the livers of mice fed DDC for 10 weeks, withdrawn 1 month (DDC primed livers) and refed 6 days, and compared with mice fed the control diet. The expression of a large number of genes changed when DDC was fed or refed. A Venn diagram analysis identified 649 genes where gene expression was changed in the same direction. The epigenetic memory of the DDC primed liver involved an increase in the expression of ubiquitin D, alpha fetoprotein, connective tissue growth factor, integrin beta 2, DNA methyl transferase 3a and DNA damage-inducible 45 gamma. DNA methyl transferase 3b was down-regulated as was Cbp/p300. When DDC was refed, DNA methyltransferase and histone deacetylase were up-regulated as shown by microarray analysis. Histone3 lysine9 acetylation was increased by DDC and DDC refeeding and DNA methyltransferases were not changed as shown by Western blot analysis. The data suggest the concept that the epigenetic memory that explains why DDC primed hepatocytes form MBs in 7 days of DDC refeeding is primarily the result of epigenetic modifications of gene expression through changes in histone acetylation and methylation, as well as DNA methylation.


Figures

Fig. 1
Fig. 1
Heat map of 3147 genes clustered from the comparison between 00–43 (Control), 00–11 (DDC fed mouse), 00–90 (DDC fed and withdrawn mouse), and 00–105 (DDC fed mouse, withdrawn and refed DDC mouse). Mouse MB Model In vivo (n=1).
Fig. 2
Fig. 2
Venn diagram of gene expression, when the control was compared with the DDC treated mice or the mouse fed DDC 10 wk and then DDC withdrawn for 5 weeks. The change in gene expression in the same direction shared by the DDC treated mice numbers 625 with 25 odd. 90 vs. 43= 2300 genes changed. 11 vs. 43= 5300 genes changed. 105 vs. 90= 6600 genes changed. 649 genes were changed in common among the three different comparisons, which includes 9319 genes in total (n=1).
Fig. 3
Fig. 3
Functional pathways where the expression of 3343 genes changed when DDC treated mice were compared with the control or the DDC withdrawn mouse (n=1)..
Fig. 4
Fig. 4
The % of the gene expression changes by functional pathways is shown when the DDC treated mice were compared to the control or the DDC withdrawn mice (625 genes) (n=1).
Fig. 5
Fig. 5
Gene expression of growth factors changed when in DDC withdrawn mice (Memory cells that form MB's) compared to the control mouse liver. Note the increased expression of Gadd45g and Ctgf (n=1).
Fig. 6
Fig. 6
HIF1 alpha expression in nuclear extracts from the livers of mice fed DDC (Mean +/− SEM, n=3).
Fig. 7
Fig. 7
The protein level of histone deacetylase (HDAC) is decreased in the liver homogenates of DDC fed mice (Mean +/− SEM, n=3).
Fig. 8
Fig. 8
The protein levels of acetylated histone 3 lysine 9 are increased in the liver homogenates of DDC fed and refed mice (Mean +/− SEM, n=3).
Fig. 9
Fig. 9
The protein levels of Dnmt3b and dimethyl histone 3 lysine 9 were unchanged in the liver homogenates by DDC feeding and refeeding (Mean +/− SEM, n=3).
Fig. 10
Fig. 10
The protein levels of Gadd45g in the liver homogenates were decreased by DDC feeding and DDC refeeding (Mean +/− SEM, n=3).
Fig. 11
Fig. 11
MB formation in vivo was associated with an increased expression of Gadd45g (SEM +/−, n=3; C vs DDC p=0.004; C vs DDC W p= 0.016). MB formation was also associated with an increased expression of CTGF (C vs DDC W p=0.03; C vs DDC R p= 0.014). The level of Gadd45g and CTGF expression in DDC W was significantly increased suggesting that the expression of these two genes may be involved in the epigenetic memory of DDC primed hepatocytes.
None

Similar articles

Cited by

References

    1. Bardag-Gorce F, van Leewen FW, Nguyen V, French BA, Li J, Riley NE, McPhaul LW, Lue YH, French SW. The role of the ubiquitin-proteasome pathway in the formation of Mallory bodies. Exp Mol Pathol. 2002;73:75–83. - PubMed
    1. Bardag-Gorce F, French BA, Joyce M, Baires M, Montgomery RO, Li J, French S. Histone acetyltransferase p300 modulates gene expression in an epigenetic manner at high blood alcohol levels. Exp Mol Pathol. 2007 Jan 5; Epub ahead of print. - PMC - PubMed
    1. Bradford MM. A rapid and sensitive method for the quantitation of microgram quantities of protein utilizing the principle of protein-dye binding. Anal Biochem. 1976;72:248–254. - PubMed
    1. French BA, van Leeuwen F, Riley NE, Yuan QX, Bardag-Gorce F, Lue YH, Marceau N, French SW. Aggresome formation in liver cells in response to different toxic mechanisms. Role of the ubiquitin-proteasome pathway and the frameshift mutant of ubiquitin. Exp Mol Pathol. 2001;71:241–246. - PubMed
    1. Gupta M, Gupta SK, Hoffman B, Liebermann DA. Gadd45a and Gadd45b protect hematopoietic cells from UV-induced apoptosis via distinct signaling pathways, including p38 activation and JNK inhibition. J Biol Chem. 2006;281:17552–17558. - PubMed

Publication types

LinkOut - more resources