. 2007 Oct 22;92(3):507-19.
doi: 10.1016/j.physbeh.2007.04.028. Epub 2007 Apr 29.

Cannabinoid-induced hyperphagia: correlation with inhibition of proopiomelanocortin neurons?

Affiliations

Cannabinoid-induced hyperphagia: correlation with inhibition of proopiomelanocortin neurons?

Jennie Ho et al. Physiol Behav. .

Abstract

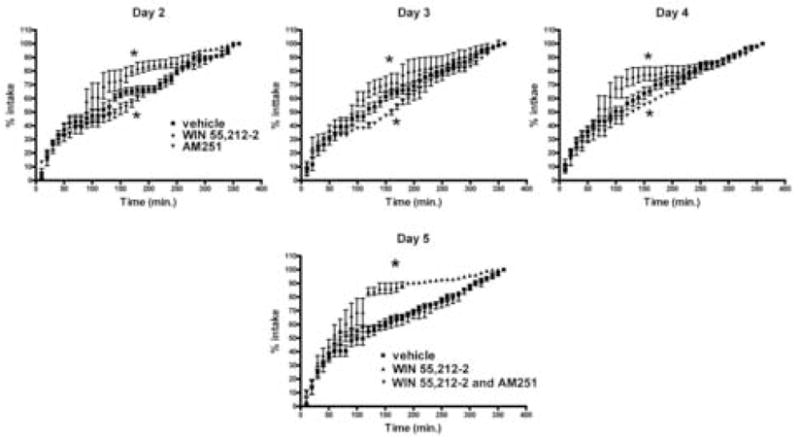
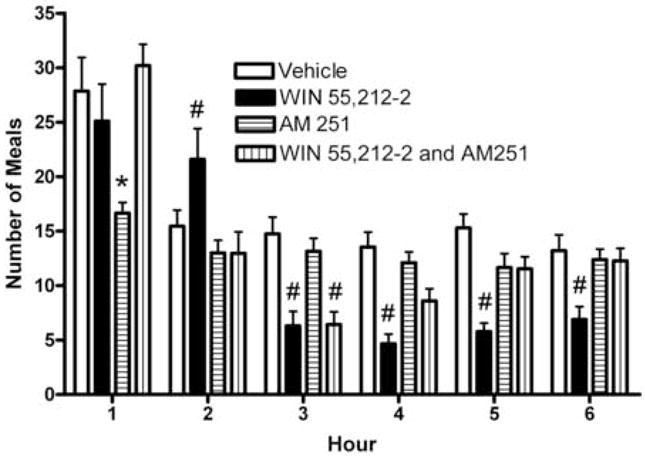
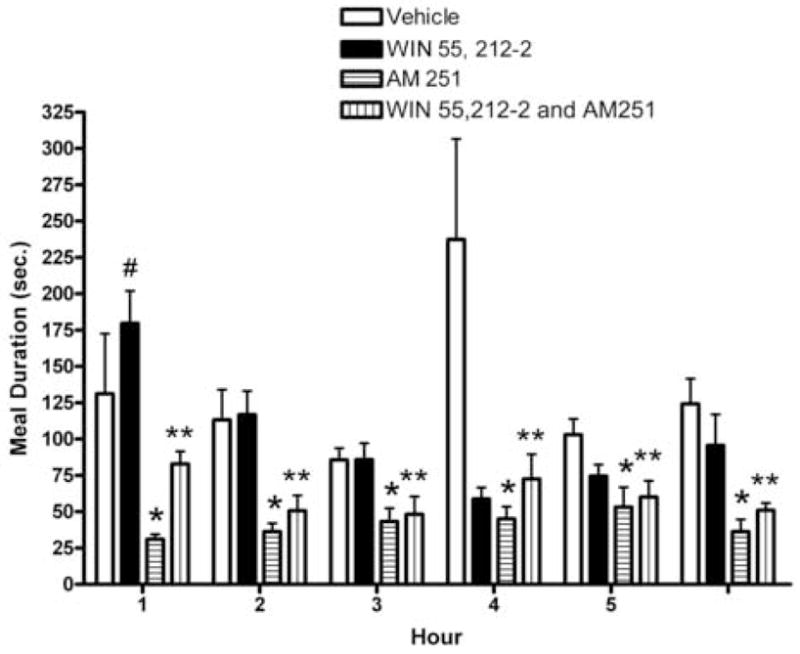
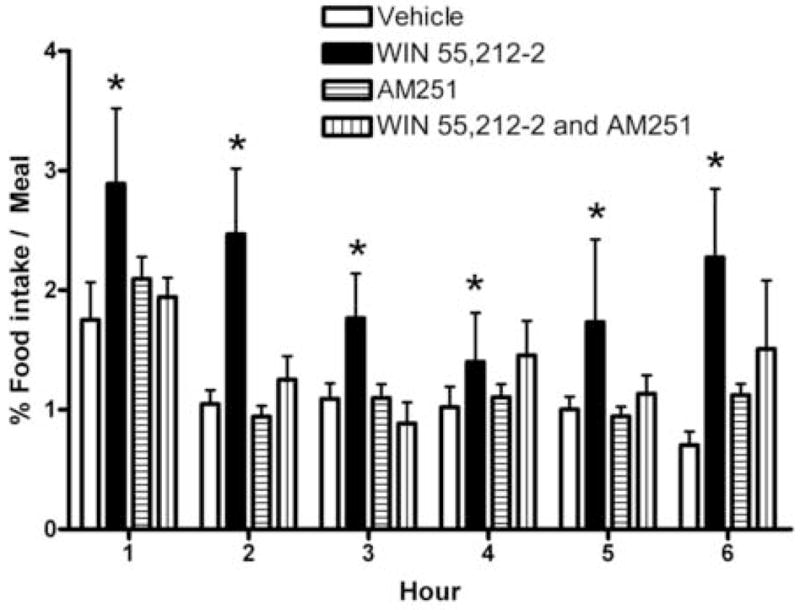
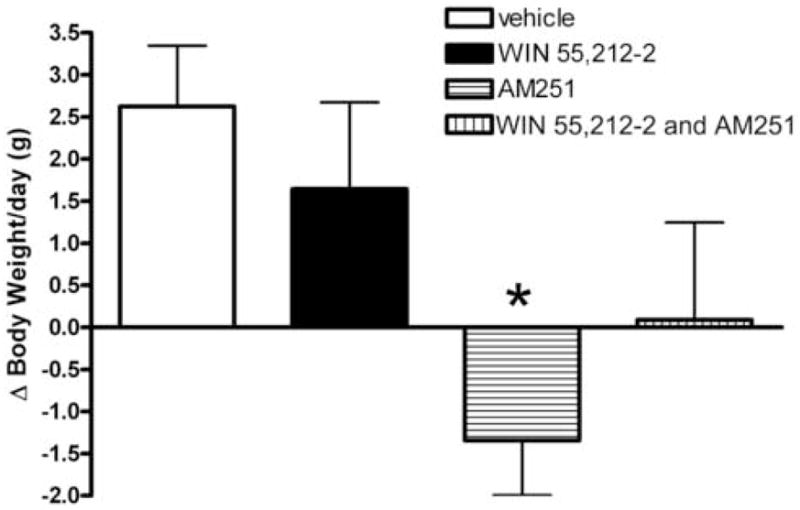
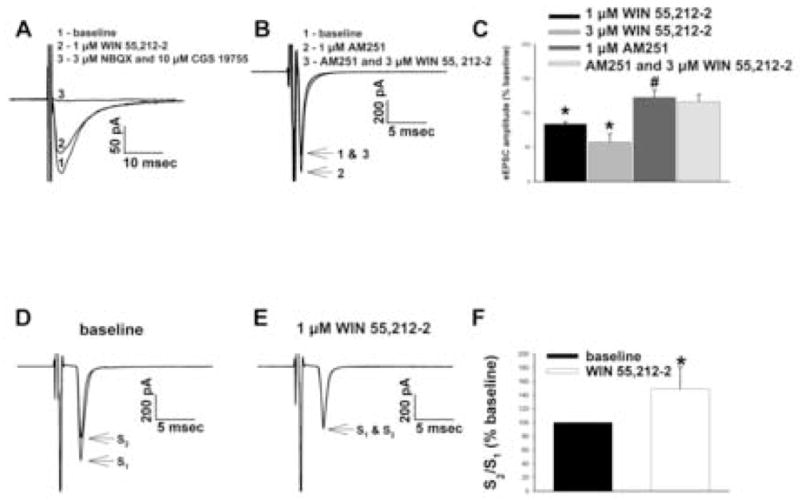
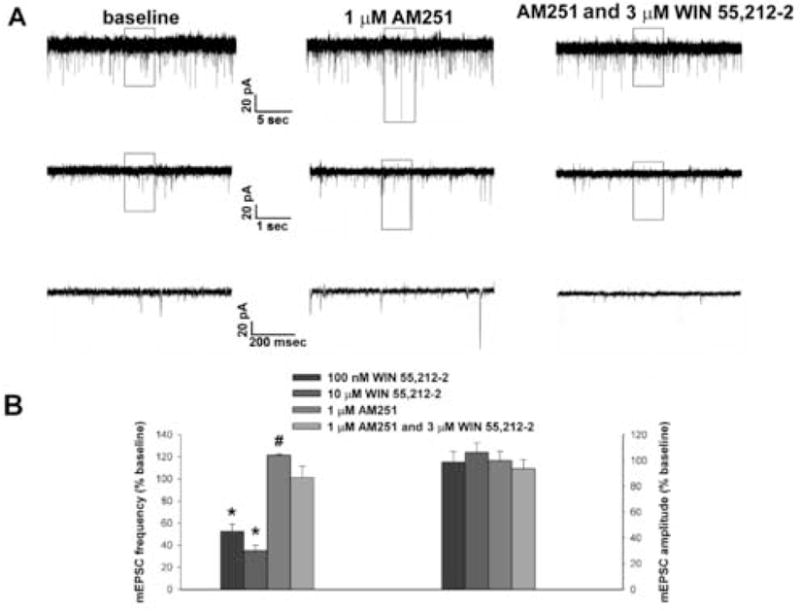
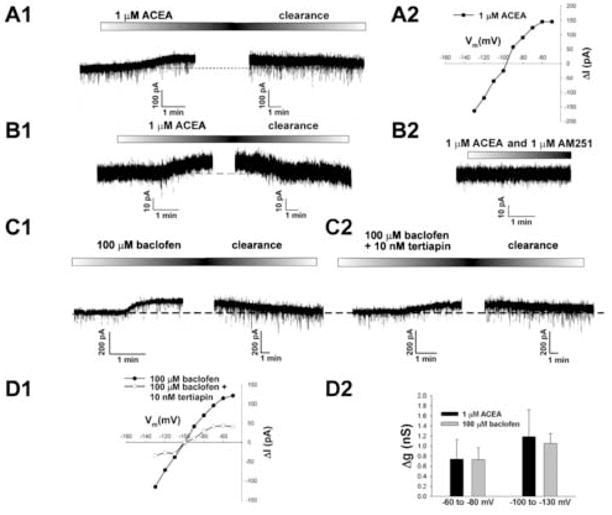
We tested the hypothesis that cannabinoids modulate feeding in male guinea pigs, and correlated cannabinoid-induced changes in feeding behavior with alterations in glutamatergic synaptic currents impinging upon proopiomelanocortin (POMC) neurons of the hypothalamic arcuate nucleus. Feeding experiments were performed as follows: after a three-day acclimation period, animals were weighed and injected with either the CB1 receptor agonist WIN 55,212-2 (1 mg/kg, s.c.), antagonist AM251 (3 mg/kg, s.c.) or their cremophore/ethanol/saline vehicle (1:1:18; 1 ml/kg, s.c.) each day for seven days. WIN 55,212-2 increased, whereas AM251 decreased, the rate of cumulative food intake. The agonist effect was manifest primarily by increases in meal frequency and the amount of food eaten per meal. By contrast, the antagonist effect was associated with decreases in meal frequency, duration and weight loss. For the electrophysiological experiments, we performed whole-cell patch-clamp recordings from POMC neurons in hypothalamic slices. WIN 55,212-2 decreased the amplitude of evoked, glutamatergic excitatory postsynaptic currents (eEPSCs) and increased the S2:S1 ratio. Conversely, AM251 increased eEPSC amplitude per se, and blocked the inhibitory effects of the agonist. WIN 55,212-2 also decreased miniature EPSC (mEPSC) frequency; whereas AM251 increased mEPSC frequency per se, and again blocked the inhibitory effect of the agonist. A subpopulation of cells exhibited an agonist-induced outward current, which was blocked by AM251, associated with increased conductance and reversed polarity near the Nernst equilibrium potential for K(+). These data demonstrate that cannabinoids regulate appetite in the guinea pig in part through both presynaptic and postsynaptic actions on anorexigenic POMC neurons.


Figures

Fig. 1
Fig. 1
The effects of CB1 receptor activation and blockade on the rate of food intake in male guinea pigs observed on representative days over the seven-day monitoring period. Animals were injected daily with either the CB1 receptor agonist WIN 55,212-2 (1 mg/kg; s.c.), the CB1 receptor antagonist AM 251 (3 mg/kg; s.c.), WIN 55,212-2 and AM251 or their cremephor/ethanol/0.9% saline vehicle, introduced into their respective feeding cages and monitored over a six-hour window. For clarity of illustration, days 2–4 show only the effects of WIN 55,212-2 and AM251 per se, whereas day 5 shows only the effect of WIN 55,212-2 alone and in combination with AM251. Symbols represent the mean and vertical lines 2 S.E.M. of the cumulative amount of food consumed at 10-minute intervals normalized to the total amount consumed at the end of the six hour window. *, Effects of WIN 55,212-2 and AM251 on the rate of food intake that are significantly different (multi-factorial ANOVA/LSD; p<0.05) than those observed either in vehicle-treated controls or in the presence of the other drug.
Fig. 2
Fig. 2
The effects of CB1 receptor activation and blockade on meal frequency. The vertical bars represent means and vertical lines 1 S.E.M. of the meal frequency defined as the number of meals eaten per hour over the six-hour monitoring window. #, Values from animals treated with WIN 55,212-2 that are significantly different (ANOVA/median-notched box-and-whisker analysis; p<0.05) than those observed in vehicle-treated controls. *, Values from AM251-treated animals that are significantly different (ANOVA/median-notched box-and-whisker analysis; p<0.05) than those from vehicle-treated controls.
Fig. 3
Fig. 3
The effects of CB1 receptor activation and blockade on meal duration. The vertical bars represent means and vertical lines 1 S.E.M. of the meal duration defined as the time necessary to ingest an amount of food ≥ 10 mg. #, Values from animals treated with WIN 55,212-2 that are significantly different (ANOVA/median-notched box-and-whisker analysis; p<0.05) than those from both vehicle-treated animals. *, Values from AM251-treated animals that are significantly different (ANOVA/median-notched box-and-whisker analysis; p<0.05) than those from vehicle-treated animals. **, Values from animals treated with both WIN 55,212-2 and AM251 that are significantly different (ANOVA/median-notched box-and-whisker analysis; p<0.05) than those observed in animals treated with AM251 alone.
Fig. 4
Fig. 4
The effects of CB1 receptor activation and blockade on the amount of food eaten per meal. Vertical bars signify means and lines 1 S.E.M. of the amount of food consumed in a given hour divided by the number of meals in that same hour. *, Values from animals treated with WIN 55212-2 that are significantly different (ANOVA/LSD; p<0.05) than those from vehicle-treated controls.
Fig. 5
Fig. 5
The effects of CB1 receptor activation and blockade on the rate of weight change. The vertical bars represent means and vertical lines 1 S.E.M. of the change in body weight per day. *, Values from AM251-treated animals that are significantly different (ANOVA/median-notched box-and-whisker analysis; p<0.05) than those from vehicle-treated animals.
Fig. 6
Fig. 6
A, WIN 55,212-2 attenuates glutamatergic eEPSCs in arcuate neurons. Currents were generated via a concentric bipolar tungsten stimulating electrode at a holding potential of −75 mV in the presence of 10 μM SR 95531. Compared to the eEPSCs elicited under baseline control conditions (1), WIN 55,212-2 reduced peak amplitude (2) of eEPSCs that were completely ablated by NBQX and CGS 19755 (3). B, AM251 prevents the cannabinoid-induced decrease in eEPSC amplitude. AM251 per se increased eEPSC amplitude (2) relative to baseline control currents (1), and reversed the inhibitory effect of WIN 55,212-2 (3). C, Composite bar graph that illustrates the CB1 receptor-mediated reduction in glutamatergic eEPSCs. Columns represent means and vertical lines 1 S.E.M. (n = 6) of the eEPSC amplitudes that were normalized to their respective baseline control values (−435.4 ± 247.6 pA; n = 16). *, Peak eEPSC amplitudes seen in the presence of WIN 55,212-2 that were significantly different (Kruskal-Wallis/Mann-Whitney U-test; p<0.05) than those observed under baseline control conditions. #, Values of eEPSC amplitude observed in the presence of AM251 that were significantly different (Kruskal-Wallis/Mann-Whitney U-test; p<0.05) than their respective baseline control values. D & E, Glutamatergic EPSCs evoked in an arcuate neuron using the paired-pulse paradigm under baseline conditions (D), and in the presence of WIN 55,212-2 (E). Paired stimuli are separated by 75 msec. F, A bar graph that illustrates the agonist-induced increase in the S2:S1 ratio. Vertical bars represent means and vertical lines 1 S.E.M. of the S2:S1 ratios observed under baseline control (solid column) and agonist-treated (open column) conditions that were normalized to control values (0.9 ± 0.2; n = 3).
Fig. 7
Fig. 7
WIN 55,212-2 selectively decreases the frequency of glutamatergic mEPSCs in arcuate neurons. A, Membrane current traces showing the spontaneous mEPSCs recorded in an arcuate neuron at a holding potential of −75 mV in the presence of 10 μM SR 95531 and 500 nM TTX. The middle traces represent excerpts from expanded portions of their respective upper traces that are contained within the bracket. The lower traces, in turn, represent excerpts from expanded portions of their respective middle traces that are contained within the bracket. The frequency of the robust mEPSCs occurring under baseline control condition (left) is reduced by 100 nM WIN 55,212-2 (middle), and still further by 10 μM WIN 55,212-2 (right). B, Cumulative probability plot on the left illustrating the increase in the interval, which is the inverse of frequency, between contiguous mEPSCs observed in the cell in A. On the right is a cumulative probability plot showing that WIN 55,212-2 has no discernable effect on mEPSC amplitude.
Fig. 8
Fig. 8
AM251 increases glutamatergic mEPSC frequency, and blocks the inhibitory effect of WIN-55,212-2. A, Membrane current traces recorded in an arcuate neuron. The middle traces represent expanded portions of their respective upper traces that are contained within the rectangle. The lower traces, in turn, enlarged segments of their respective middle traces that are contained within the rectangle. Note that AM251 alone increases the number mEPSCs, whereas in combination with WIN 55,212-2 the number of mEPSCs is nearly identical to that observed under baseline control conditions. B, Composite bar graph demonstrating the selective CB1 receptor-mediated decrease in mEPSC frequency but not amplitude. Columns represent means and vertical lines 1 S.E.M. (n = 3 – 5) of the mEPSC frequency (left) and amplitude (right) values that were normalized to their respective control values (4.0 ± 0.7 Hz; −13.2 ± 2.2 pA; n = 20). *, Values of mEPSC frequency observed in the presence of WIN 55,212-2 that were significantly different (Kruskal-Wallis/Mann-Whitney U-test; p<0.05) than those encountered under baseline control conditions. #, Values of mEPSC frequency observed in the presence of AM251 that were significantly different (Kruskal-Wallis/Mann-Whitney U-test; p<0.05) than their respective baseline control values.
Fig. 9
Fig. 9
A1, A reversible outward current elicited by the anandamide derivative ACEA in an arcuate neuron from an intact male guinea pig. This outward current was produced by ACEA (1 μM) from a holding potential of −60 mV in the presence of 1 μM TTX. The break in the trace in the upper panel represents the time necessary to conduct a second I/V relationship, and the early stages of ACEA clearance from the slice. A2, An I/V plot that reveals the ACEA-induced increase in slope conductance as well as the reversal potential (−97 mV) near the Nernst equilibrium potential for K+. The symbols represent the changes in membrane current (ΔI) observed at different membrane voltages (Vm) that were caused by ACEA. The increase in slope conductance estimated by linear regression between −60 & −80 mV was (2.75 nS), whereas that between −100 & −130 mV was even greater (4.76 nS; rectification ratio: 1.7). B1, Another example of the CB1 receptor-mediated outward current recorded in an arcuate neuron from a male guinea pig. As with A1, this reversible, ACEA-induced outward current (12.2 pA at −60 mV) was observed in the presence of 1 μM TTX. The break in the trace represents the time necessary to conduct a second I/V in the presence of drug, as well as the early stages of drug clearance from the slice. B2, This trace shows the effect of ACEA observed in the presence of the CB1 receptor antagonist AM251 (1 μM). The data was obtained from the same neuron as in B1. Note that AM251 completely blocked the ACEA-induced outward current. C1, The GABAB receptor-mediated activation of GIRK in an arcuate neuron from a male guinea pig. This panel shows the reversible, outward current elicited by the GABAB receptor agonist baclofen (100 μM) from a holding potential of −60 mV in the presence of 1 μM TTX. The break in the trace represents the time necessary to complete a second I/V relationship, and the early stages of drug clearance from the slice. C2, The attenuation in the GABAB receptor-mediated activation of the outward current by the GIRK channel blocker tertiapin in the arcuate neuron shown in C1. This panel shows the reduction in the reversible, baclofen-induced outward current in the presence of TTX and tertiapin (10 nM). The break in the trace represents the time necessary to complete a second I/V relationship, and the early stages of drug clearance from the slice. D1, This panel shows an I/V plot revealing the baclofen-induced increase in slope conductance and the reversal potential (−100 mV) that closely approximates the Nernst equilibrium potential for K+. The symbols represent the change in membrane current (ΔI) observed at different membrane voltages (Vm) that were caused by baclofen (solid circles) or by baclofen in the presence of tertiapin (open circles). The slope conductance estimated by linear regression between −60 & −80 mV was 2.23 nS, and that observed between −100 & −130 mV was even greater (3.78 nS; rectification ratio: 1.7). Tertiapin reduced this baclofen-induced increase in the slope conductance nearly 70% (to 0.7 nS) between −60 & −80 mV, and nearly 75% (to 1.00 nS) between −100 & −130 mV. D2, , A bar graph showing the change in slope conductance (Δ g) evoked by CB1 and GABAB receptor activation at different portions of individual I/V plots. Agonist-induced Δ g is estimated by linear regression between −60 & −80 mV, and between −100 & −130 mV. Columns represent the means and vertical lines 1 S.E.M. of the Δ g caused by 1 μM ACEA (dark columns; n=7) and 100 μM baclofen (gray columns; n=21).
Fig. 10
Fig. 10
Double-labeling of an arcuate neuron that is immunopositive for a phenotypic marker characteristic of POMC neurons. A, Color photomicrograph that illustrates the biocytin-streptavidin-cy2 labeling (denoted by the arrow). B, Color photomicrograph of the α-MSH immunofluorescence observed in the perikarya of A as visualized with cy3 (also denoted by the arrow). C, Composite overlay illustrating the double labeling in this arcuate neuron. All photomicrographs were taken with a 40X objective.

Similar articles

Cited by

References

    1. Williams CM, Kirkham TC. Reversal of Δ 9-THC hyperphagia by SR141716 and naloxone but not dexfenfluramine. Pharmacol. Biochem. Behav. 2002;71:341–348. - PubMed
    1. Berry EM, Mechoulam R. Tetrahydrocannabinol and endocannabinoids in feeding and appetite. Pharmac Ther. 2002;95:185–190. - PubMed
    1. Wachtel SR, Elsohly MA, Ross SA, Ambre J, De Wit H. Comparison of the subjective effects of Δ 9-tetrahydrocannabinol and marijuana in humans. Psychopharmacology (Berl) 2002;161:331–339. - PubMed
    1. Cota D, Marsicano G, Lutz B, Vicennati V, Stalla GK, Pasquali R, Pagotto U. Endogenous cannabinoid system as a modulator of food intake. Int J Obesity. 2003;27:289–301. - PubMed
    1. Fride E, Bregman T, Kirkham TC. Endocannabinoids and food intake: newborn suckling and appetite regulation in adulthood. Exp Biol Med. 2005;230:225–234. - PubMed

Publication types

MeSH terms