. 2007 Jun 15;110(2):110-20.
doi: 10.1016/j.imlet.2007.04.007. Epub 2007 May 15.

Thymosin-alpha1 modulates dendritic cell differentiation and functional maturation from human peripheral blood CD14+ monocytes

Affiliations

Thymosin-alpha1 modulates dendritic cell differentiation and functional maturation from human peripheral blood CD14+ monocytes

Qizhi Yao et al. Immunol Lett. .

Abstract

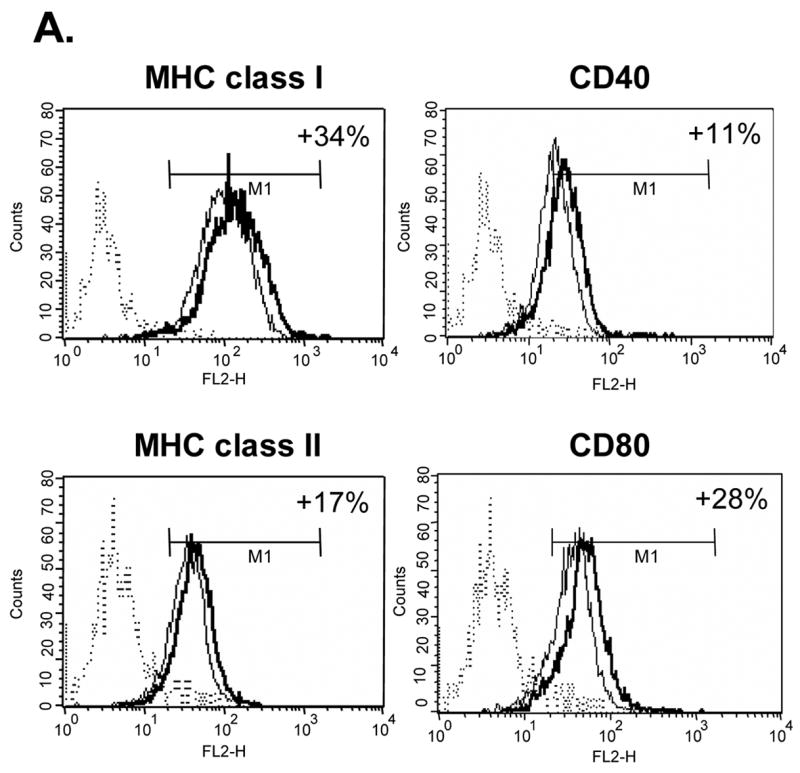
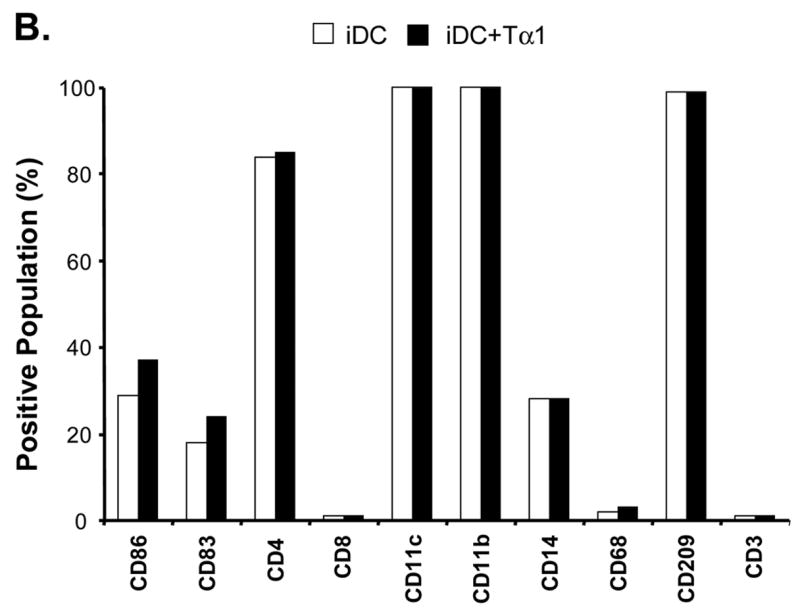
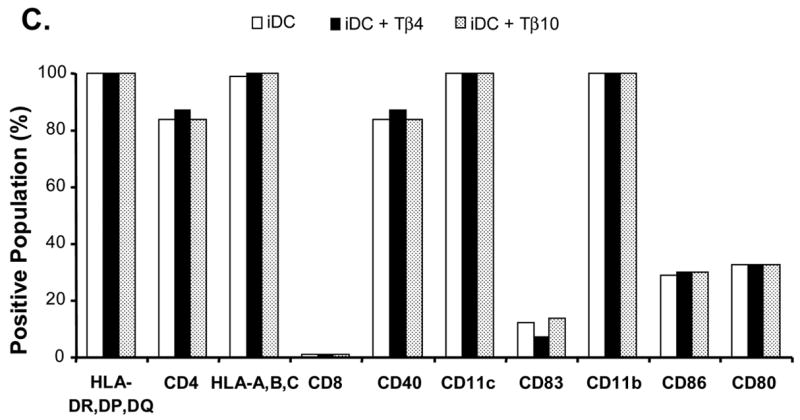
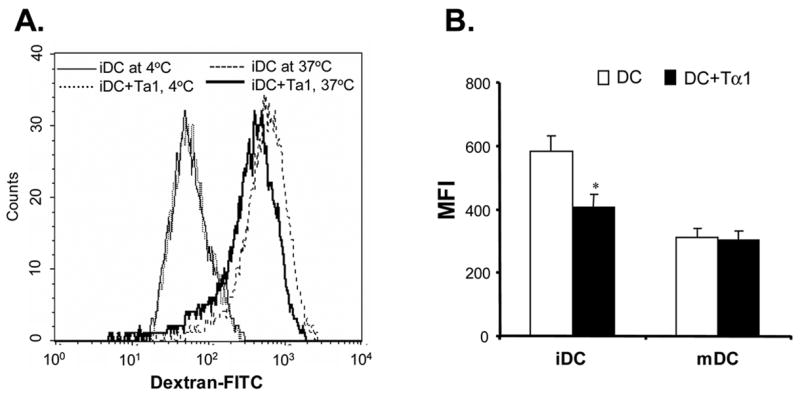
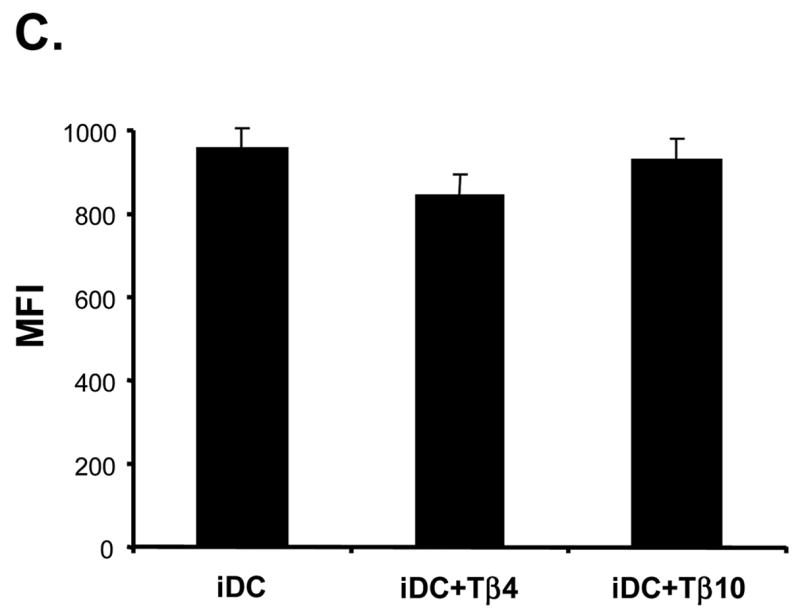
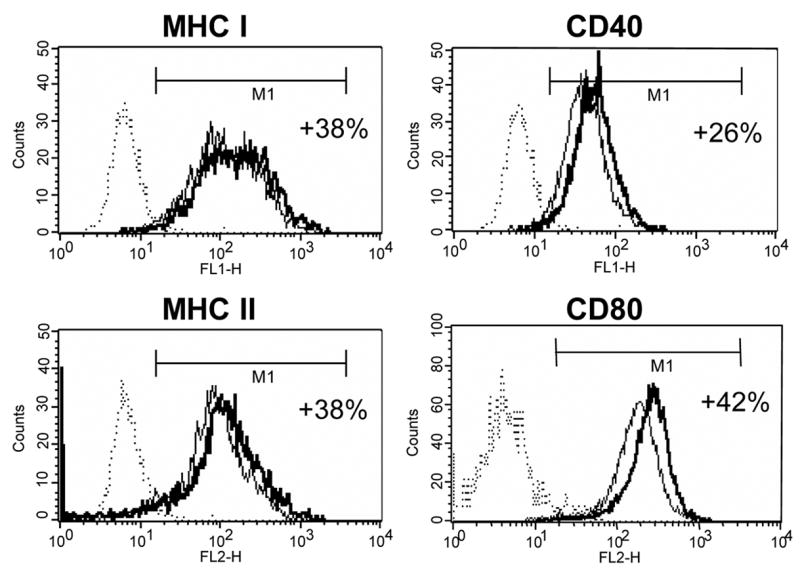
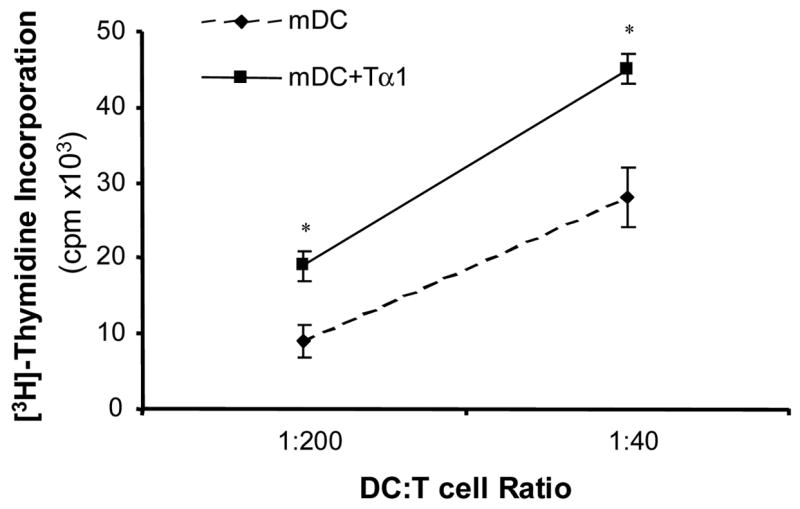
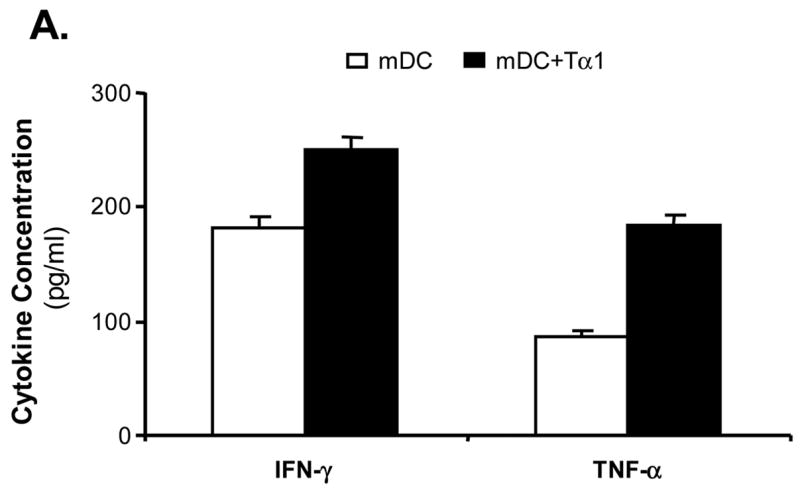
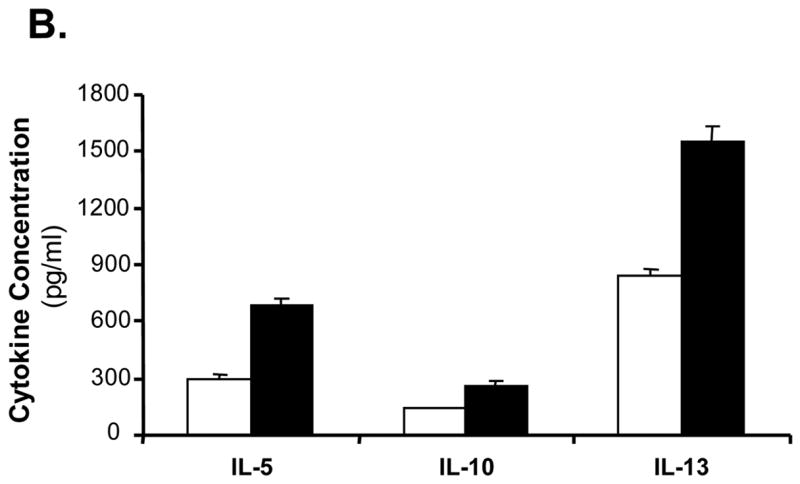
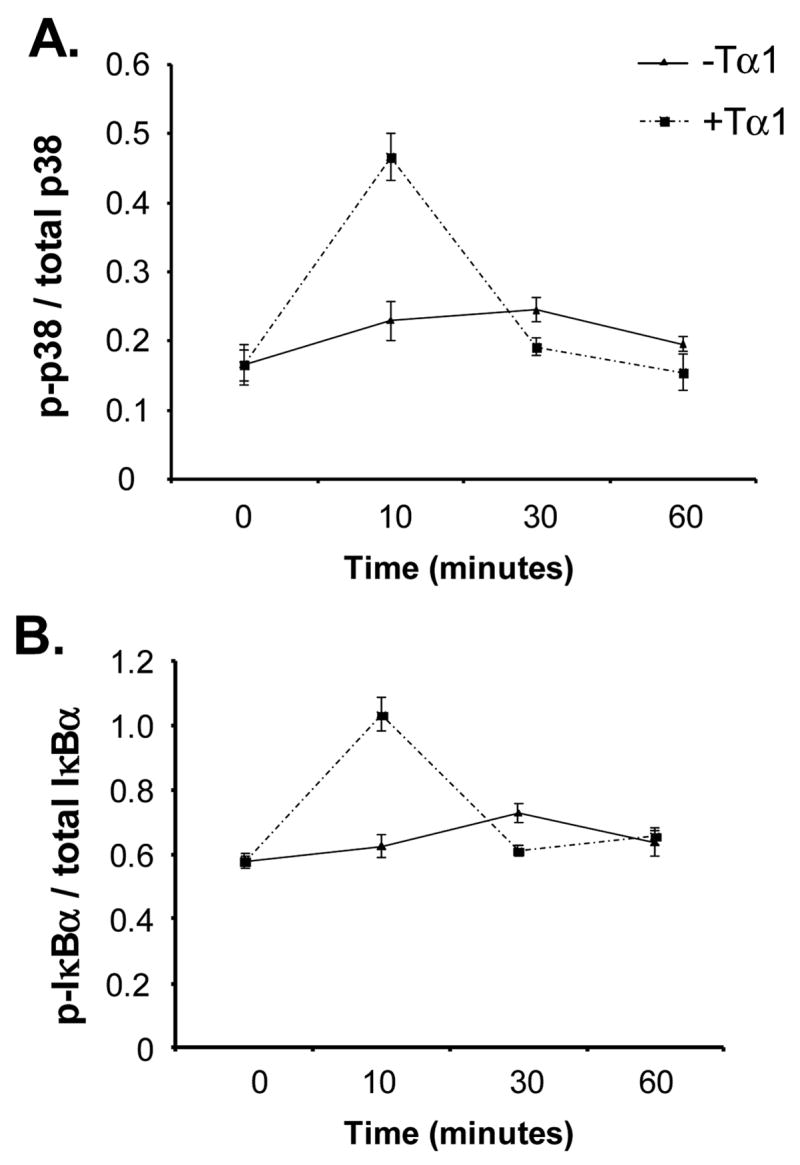
Although thymosins have been demonstrated to have immunomodulatory effects, it is still not clear whether they could affect dendritic cells (DCs), the most professional antigen-presenting cells. The objective of this study was to determine the effect and potential mechanisms of thymosin-alpha1 (Talpha1) on DC differentiation and functional maturation. Human peripheral blood CD14(+) monocytes were purified by using a magnetic separation column and cultured with GM-CSF and IL-4 to differentiate into immature DCs (iDCs). In the presence of Talpha1, iDC surface markers CD40, CD80, MHC class I and class II molecules were significantly upregulated as measured by flow cytemotry analysis. However, Tbeta4 or Tbeta10 did not show these effects on iDCs. There was an approximately 30% reduction in antigen (FITC-conjugated dextran)-uptake by Talpha1-treated iDCs as compared with non-Talpha1-treated iDCs. In addition, Talpha1-treated matured DCs (mDCs) showed an increased stimulation of allogeneic CD3(+) T-cell proliferation as measured by a mixed-lymphocyte reaction assay. Talpha1-treated mDCs also increased the production of several Th1- and Th2-type cytokines as measured by a Bio-Plex cytokine assay. Furthermore, rapid activation of p38 MAPK and NFkappaB was seen in Talpha1-treated iDCs as measured by a Bio-Plex phosphoprotein assay. Thus, Talpha1 significantly enhances DC differentiation, activation, and functions from human peripheral blood CD14(+) monocytes possibly through a mechanism of the activation of p38 MAPK and NFkappaB pathways. This study provides a basis to further evaluate Talpha1 as a possible adjuvant for a DC-directed vaccine or therapy.


Figures

Figure 1
Figure 1
Effects of Tα1 on iDCs cell surface marker expression. CD14+ monocytes were induced to differentiate to iDCs in DC growth medium containing 500 U/mL rhGM-CSF and 500 U/mL rhIL-4 in the presence or absence of Tα1 (50 ng/mL), Tβ4 or Tβ10 (50 ng/mL) over the course of 5 days. Cell surface marker expression was stained for FACS analysis at day 5. iDC represents immature DC. IDC + Tα1 represents differentiation into immature DCs in the presence of Tα1 treatment. Data were statistically analyzed with student t-test. Data represented in this figure are representative of one from more than three experiments with DC preparations from different donors. (A) FACS histograms representing in percentages of changes in mean fluorescence intensity (MFI), relative to untreated controls, the elevated expression of cell surface markers MHC class I, MHC class II, CD40 and CD80 expression in the presence of Tα1 during DC differentiation. Dotted lines represent isotype controls. Solid lines represent untreated-controls. Bold lines represent Tα1-treated iDCs. Percentage values as denoted represent positive change of mean fluorescence intensity (MFI) after Tα1 treatment. Statistical t-test values for each marker are p < 0.01. (B) iDC surface markers that are not affected by Tα1 treatment. Y-axis represents percentage of marker staining positive cells. X-axis shows different markers determined. Data were statistically analyzed with student t-test values p > 0.05. (C) Beta- thymosin treatment does not affect iDCs surface markers expression. iDC + Tβ4 represents differentiation into immature DCs in the presence of Tβ4 treatment. iDC + Tβ10 represents differentiation into immature DCs in the presence of Tβ10 treatment. Y-axis represents percentage of marker staining positive cells. X-axis shows different markers determined. Data were statistically analyzed with student t-test values p > 0.05.
Figure 1
Figure 1
Effects of Tα1 on iDCs cell surface marker expression. CD14+ monocytes were induced to differentiate to iDCs in DC growth medium containing 500 U/mL rhGM-CSF and 500 U/mL rhIL-4 in the presence or absence of Tα1 (50 ng/mL), Tβ4 or Tβ10 (50 ng/mL) over the course of 5 days. Cell surface marker expression was stained for FACS analysis at day 5. iDC represents immature DC. IDC + Tα1 represents differentiation into immature DCs in the presence of Tα1 treatment. Data were statistically analyzed with student t-test. Data represented in this figure are representative of one from more than three experiments with DC preparations from different donors. (A) FACS histograms representing in percentages of changes in mean fluorescence intensity (MFI), relative to untreated controls, the elevated expression of cell surface markers MHC class I, MHC class II, CD40 and CD80 expression in the presence of Tα1 during DC differentiation. Dotted lines represent isotype controls. Solid lines represent untreated-controls. Bold lines represent Tα1-treated iDCs. Percentage values as denoted represent positive change of mean fluorescence intensity (MFI) after Tα1 treatment. Statistical t-test values for each marker are p < 0.01. (B) iDC surface markers that are not affected by Tα1 treatment. Y-axis represents percentage of marker staining positive cells. X-axis shows different markers determined. Data were statistically analyzed with student t-test values p > 0.05. (C) Beta- thymosin treatment does not affect iDCs surface markers expression. iDC + Tβ4 represents differentiation into immature DCs in the presence of Tβ4 treatment. iDC + Tβ10 represents differentiation into immature DCs in the presence of Tβ10 treatment. Y-axis represents percentage of marker staining positive cells. X-axis shows different markers determined. Data were statistically analyzed with student t-test values p > 0.05.
Figure 2
Figure 2
Effect of Tα1 treatment on iDC endocytosis function. (A) The function of dextran-FITC endocytosis by iDCs or Tα1-treated iDCs was analyzed by FACS. iDCs (1×10⁵) were incubated at 37°C for 30 minutes in the presence of 200 μg/mL Dextran-FITC beads. Controls were respective iDCs incubated at 4°C. (B) Comparison of mean fluorescence intensity changes between iDCs and Tα1-treated iDCs or mDCs and Tα1-treated mDCs in Dextran-FITC endocytosis assay. mDCs were generated from iDCs by the addition of 10 ng/mL of TNF-α for 48 h. Error bars represent standard deviation of three separate experiments from one donor. * represents a student t-test value of p < 0.05. Data represented in this figure are representative of one from more than three experiments with DC preparations from different donors. (C) Beta-thymosin treatment does not alter iDC endocytosis function. No changes were apparent in the mean fluorescent intensity (MFI) between iDC and Tβ-treated iDC samples and their controls in the endocytosis assay. Error bars represent standard deviation of three separate experiments from one donor. Data were statistically analyzed with student t-test values p > 0.05. Data represented in this figure are representative of one from more than three experiments with DC preparations from different donors.
Figure 2
Figure 2
Effect of Tα1 treatment on iDC endocytosis function. (A) The function of dextran-FITC endocytosis by iDCs or Tα1-treated iDCs was analyzed by FACS. iDCs (1×10⁵) were incubated at 37°C for 30 minutes in the presence of 200 μg/mL Dextran-FITC beads. Controls were respective iDCs incubated at 4°C. (B) Comparison of mean fluorescence intensity changes between iDCs and Tα1-treated iDCs or mDCs and Tα1-treated mDCs in Dextran-FITC endocytosis assay. mDCs were generated from iDCs by the addition of 10 ng/mL of TNF-α for 48 h. Error bars represent standard deviation of three separate experiments from one donor. * represents a student t-test value of p < 0.05. Data represented in this figure are representative of one from more than three experiments with DC preparations from different donors. (C) Beta-thymosin treatment does not alter iDC endocytosis function. No changes were apparent in the mean fluorescent intensity (MFI) between iDC and Tβ-treated iDC samples and their controls in the endocytosis assay. Error bars represent standard deviation of three separate experiments from one donor. Data were statistically analyzed with student t-test values p > 0.05. Data represented in this figure are representative of one from more than three experiments with DC preparations from different donors.
Figure 3
Figure 3
Effect of Tα1 on the expression of important cell surface markers on mDCs. iDCs on day 5 were induced to activate and mature in DC growth media containing 500 U/mL rhGM-CSF, 500 U/mL rhIL-4 and 10ng/mL of TNF-α in the presence or absence of Tα1 (50 ng/mL) over the course of 48 h. Cell surface marker expression was stained for FACS analysis at day 7. FACS histograms representing in percentages, relative to untreated controls, the elevated expression of cell surface markers MHC class I, MHC class II, CD40 and CD80 expression in the presence of Tα1 during DC maturation. Dotted lines represent isotype controls. Solid lines represent untreated-controls. Bold lines represent Tα1-treated iDCs. Statistical t-test values for each marker is p < 0.01. Data represented in this figure are representative of one from more than three experiments with DC preparations from different donors.
Figure 4
Figure 4
Effect of Tα1-treated mDCs on allogeneic T-cell proliferation. The allostimulatory activity of mDCs and Tα1-treated mDCs to T cells was measured by MLR assay at two different ratios of mDCs to CD3+ T cells. mDCs were irradiated, and allogeneic CD3+ T cells were positively selected using MACS microbeads. mDCs and T cells were mixed and incubated for 5 days at 37°C followed by a 16-hour incubation with 0.5 μCi of [3H]-thymidine. Radioactive thymidine incorporation into proliferating T cells were measured and determined in counts per minute. Error bars are standard deviation. * represents a student statistical t-test value of p < 0.05. Similar results were obtained in three separate experiments.
Figure 5
Figure 5
Effect of Tα1-treated mDCs on broad T-cell cytokines release. Supernatant of the incubation media from the MLR assay was collected 24-hour post incubation. Cytokines released from allogeneic T cells having been activated by mDCs or Tα1-treated mDCs were analyzed by the Bioplex multiplex Th1/Th2 cytokine assay. (A) Th1-type cytokines. (B) Th2-type cytokines. Supernatants were collected from three different MLR experiments. The cytokine levels shown are the average cytokine concentration from three different experiments. Error bars are standard deviation.
Figure 5
Figure 5
Effect of Tα1-treated mDCs on broad T-cell cytokines release. Supernatant of the incubation media from the MLR assay was collected 24-hour post incubation. Cytokines released from allogeneic T cells having been activated by mDCs or Tα1-treated mDCs were analyzed by the Bioplex multiplex Th1/Th2 cytokine assay. (A) Th1-type cytokines. (B) Th2-type cytokines. Supernatants were collected from three different MLR experiments. The cytokine levels shown are the average cytokine concentration from three different experiments. Error bars are standard deviation.
Figure 6
Figure 6
Effect of Tα1 on the activation of p38-MAPK and NFκB signaling pathways. Tα1-treated CD14+ monocytes were collected at the specified time points and lysed to release their protein contents. The levels of phosphorylation and totoal protein of p38-MAPK and IκBα were measured by the BioPlex immunoassay. The data are presented as the ratio of phosphorylated protein and total protein for each molecule. (A) Representation of the ratio of phosphorylated p38 kinase and total p38. (B) Representation of the ratio of phosphorylated IκBα kinase and total IκBα. Results are representative of triplicate assay points from 3 donors.

Similar articles

Cited by

References

    1. Manca F, Li Pira G, Fenoglio D, Fang SP, Habeshaw A, Knight SC, et al. Dendritic cells are potent antigen-presenting cells for in vitro induction of primary human CD4+ T-cell lines specific for HIV gp120. J Acquir Immune Defic Syndr. 1994;7:15–23. - PubMed
    1. Shortman K, Liu YJ. Mouse and human dendritic cell subtypes. Nat Rev Immunol. 2002;2:151–61. - PubMed
    1. Banchereau J, Steinman RM. Dendritic cells and the control of immunity. Nature. 1998;392:245–52. - PubMed
    1. Langhoff E, Steinman RM. Clonal expansion of human T lymphocytes initiated by dendritic cells. J Exp Med. 1989;169:315–20. - PMC - PubMed
    1. Inaba K, Young JW, Steinman RM. Direct activation of CD8+ cytotoxic T lymphocytes by dendritic cells. J Exp Med. 1987;166:182–94. - PMC - PubMed

Publication types

MeSH terms